 InjuryJosh Jacobs: Questionable → Out25 min ago
 Vikings DeskVikings pass more on early downs each week, and the offense keeps sliding26 min ago
 Chiefs DeskChiefs fix their early-down mix and the offense follows in Week 927 min ago
 Atlanta FalconsFalcons 'feel good' about Corey Levin stepping in as starting center
 Baltimore RavensKyle Hamilton Practicing, Jaylinn Hawkins Returns
 ESPNJ.J. McCarthy makes his first Giants home start against the desperate Commanders
 New York JetsJets Stock Report | Dylan Parham, Breece Hall Boost Already Strong Run Game
 ESPNMike Tomlin: 'Excited' about broadcast role, hasn't considered coaching return
 Tampa Bay Buccaneers2026 Rookie Class Bye Week Check-In
 Dallas CowboysCowboys sign RB Kendre Miller to practice squad
 Titans DeskTitans offense ranks 27th in EPA per play and the defense gives it back57 min ago
 Los Angeles ChargersLos Angeles Chargers Name Stalwart Law Group Official Law Firm in Multiyear Partnership
 Carolina PanthersPanthers in the power rankings before Week 10 against the New Orleans Saints
 Pro Football RumorsColts Turned Down Pair Of Day 3 Picks For DT Grover Stewart
 Seahawks DeskSeahawks defense ranks fifth in EPA allowed while the offense sits 23rd1 h ago
 Jaguars DeskJaguars defense covers for an offense that slipped to 0.05 EPA a play1 h ago
Compare players
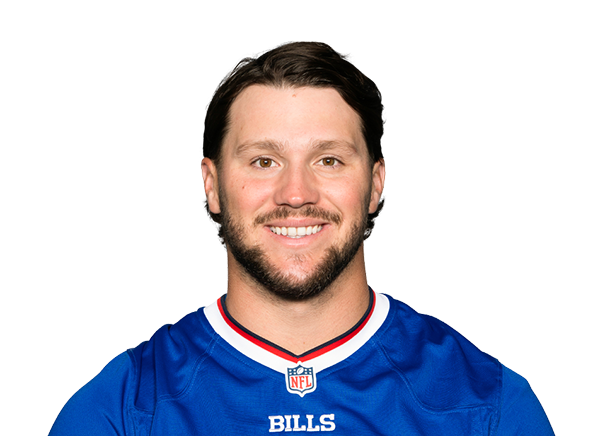 Josh AllenQB · BUF
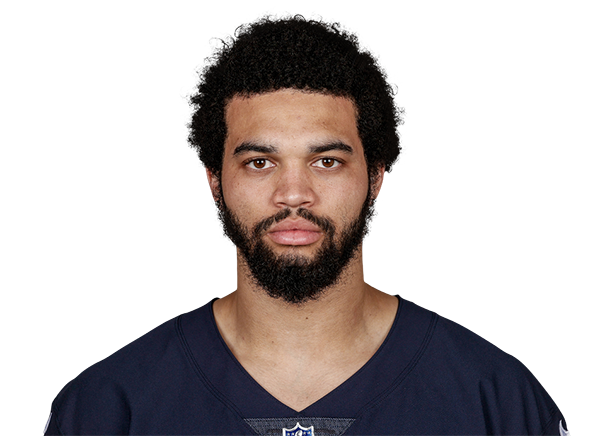 Caleb WilliamsQB · CHI
 Buffalo Bills
Josh Allen
Wyoming · 2018 draft, round 1, pick 7
 Chicago Bears
Caleb Williams
USC · 2024 draft, round 1, pick 1
Across the 8 shown metrics with numbers for at least two players (2026 season, per opportunity): Allen leads in 6 and Williams leads in 2. A count of who is ahead, not a verdict: the metrics overlap and do not weigh the same.
Usage
AllenWilliamsPercentile chips: vs 34 QBs who played half the games, 2026 season
Passing
AllenWilliamsPercentile chips: vs 35 QBs who have 12+ dropbacks a week, 2026 season
Rushing
AllenWilliamsAdvanced metrics14 more · tap to open
Usage
Passing
Rushing
Advanced rows are not part of the “metrics led” count. Pick exactly what you want under “Choose”.
Expected points added across every role (passing, rushing, receiving) in the nflverse play-by-play model, in the period you picked. Lines run the total; a missing bar is a week without plays. The dot marks the best week among the 2 players.
Matchups to start with
top passers · most targetedBox score totals from ESPN (regular season and playoffs; “last 4” is each player's four most recent games with a box score line). EPA, success rate, CPOE, aDOT, target and air-yard share from the nflverse play-by-play over the same games; snap share from nflverse snap counts. EPA per dropback includes sacks and scrambles. Carries are the official ESPN rush attempts; EPA per designed run leaves out quarterback scrambles (they count as dropbacks) and kneel-downs, so for a quarterback the two counts differ. Per opportunity divides counting stats by nflverse dropbacks (passing), ESPN targets (receiving) and ESPN carries (rushing); other counts go per game. Percentiles rank each value among players at the same position with enough volume in the same period (the same groups as the player cards: QBs 12 dropbacks a week, RBs 4.5 carries, wide receivers 2.5 targets, tight ends 2, defenders half the games; fewer than 8 peers, no percentile). The bars compare the players on the page only, not the league.