 InjuryChad Ryland: Active → Cleared14 min ago
 Pro Football RumorsColts Shut Down WR Alec Pierce For Remainder Of Season
Players / quarterbacks
2026 · through week 11 · 30 qualified of 110
The best quarterbacks
Grade = average percentile of epa per dropback, completion % over expected, yards per attempt, touchdown rate, interception rate (lower is better), sack rate (lower is better), against every qualified quarterback. Click any column to sort; download the table as CSV.
| # | ||||||||||
|---|---|---|---|---|---|---|---|---|---|---|
| 1 | 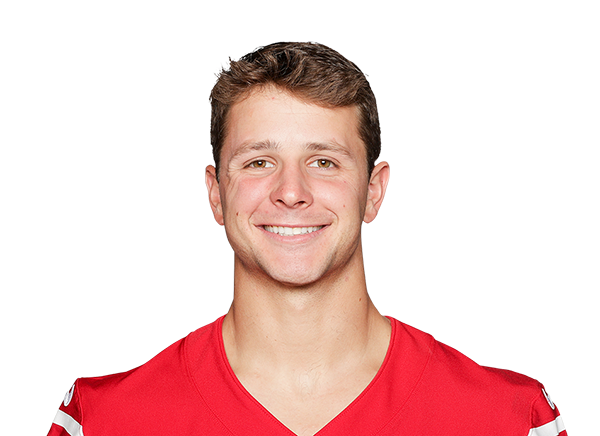 Brock Purdy  QB · SF | 86 | Pro Bowl | +0.31698 | +5.488 | 9.098 | 7.6%92 | 1.9%62 | 4.4%78 | 9 |
| 2 | 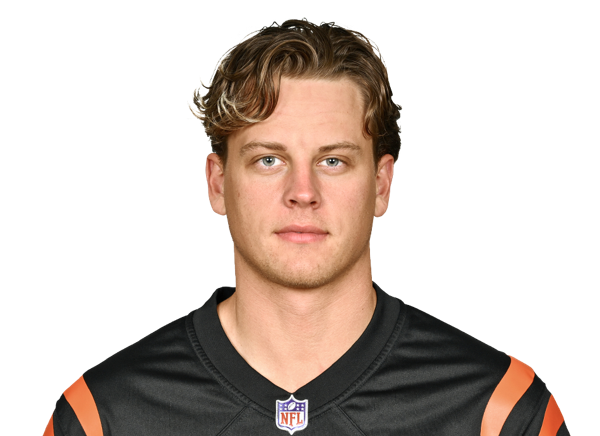 Joe Burrow  QB · CIN | 86 | Pro Bowl | +0.26592 | +10.598 | 8.285 | 7.9%95 | 1.8%72 | 4.4%75 | 9 |
| 3 | 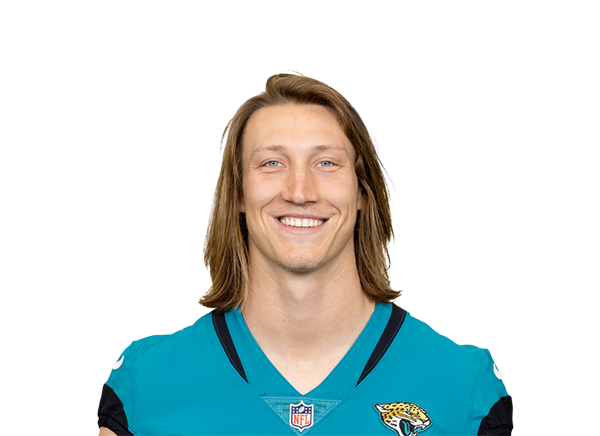 Trevor Lawrence  QB · JAX | 82 | Pro Bowl | +0.28195 | +4.285 | 8.895 | 8.1%98 | 1.9%55 | 4.9%65 | 9 |
| 4 | 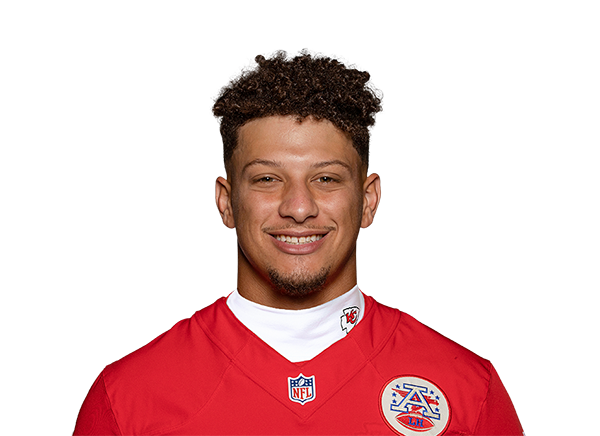 Patrick Mahomes  QB · KC | 81 | Pro Bowl | +0.16478 | +1.968 | 8.078 | 6.4%85 | 1.3%85 | 3.7%92 | 9 |
| 5 |  C.J. Stroud  QB · HOU | 74 | Starter | +0.16275 | +1.565 | 7.768 | 6.3%78 | 1.2%92 | 4.8%68 | 10 |
| 6 |  Jared Goff  QB · DET | 72 | Starter | +0.17885 | +0.858 | 8.082 | 5.9%75 | 1.3%88 | 6.3%45 | 9 |
| 7 |  Drake Maye  QB · NE | 66 | Starter | +0.14672 | +7.095 | 8.488 | 6.5%88 | 4.0%8 | 6.5%42 | 10 |
| 8 |  Josh Allen  QB · BUF | 66 | Starter | +0.20888 | +2.775 | 8.692 | 5.1%58 | 2.7%25 | 6.0%55 | 9 |
| 9 | 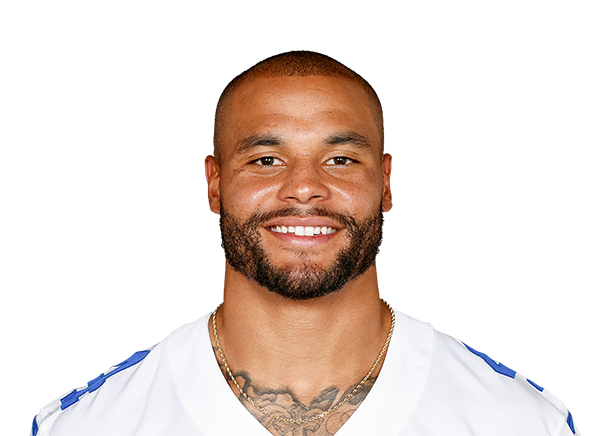 Dak Prescott  QB · DAL | 65 | Starter | +0.14268 | -0.135 | 7.045 | 5.4%68 | 1.6%75 | 3.5%98 | 10 |
| 10 | 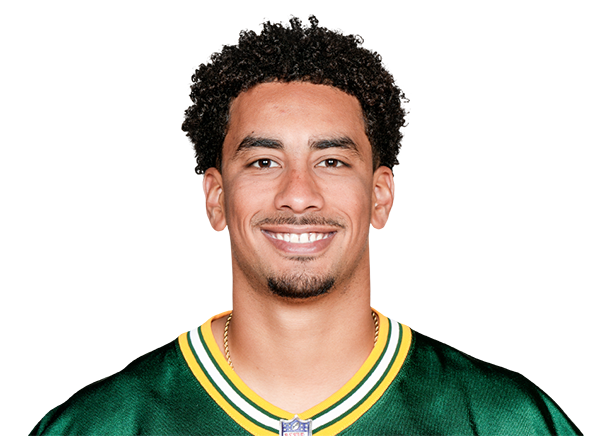 Jordan Love  QB · GB | 63 | Starter | +0.12965 | +1.062 | 7.772 | 5.4%72 | 1.9%58 | 6.3%48 | 10 |
| 11 | 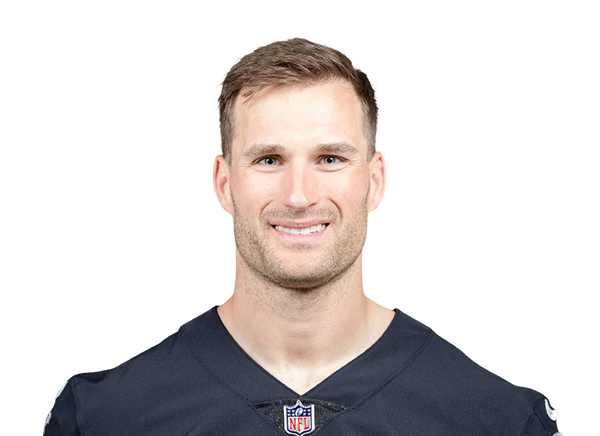 Kirk Cousins  QB · MIN | 63 | Starter | +0.10562 | +0.252 | 7.462 | 6.4%82 | 2.6%32 | 3.8%88 | 10 |
| 12 | 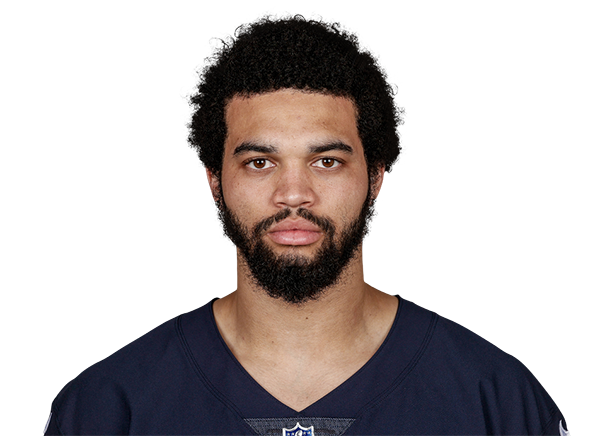 Caleb Williams  QB · CHI | 61 | Starter | +0.16682 | +6.092 | 7.975 | 4.1%28 | 2.6%35 | 6.2%52 | 6 |
| 13 | 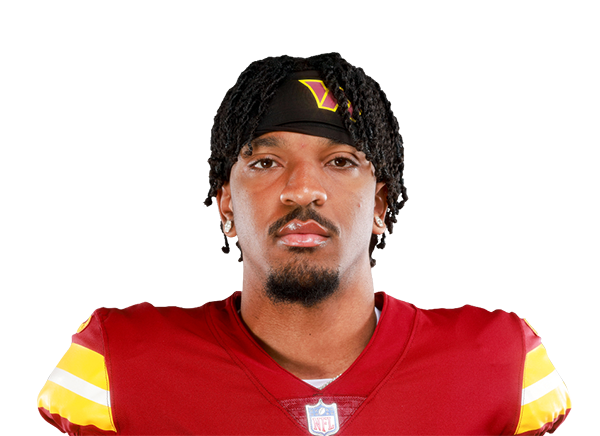 Jayden Daniels  QB · WSH | 60 | Starter | +0.06555 | +4.182 | 7.042 | 4.7%42 | 0.9%98 | 6.6%38 | 7 |
| 14 | 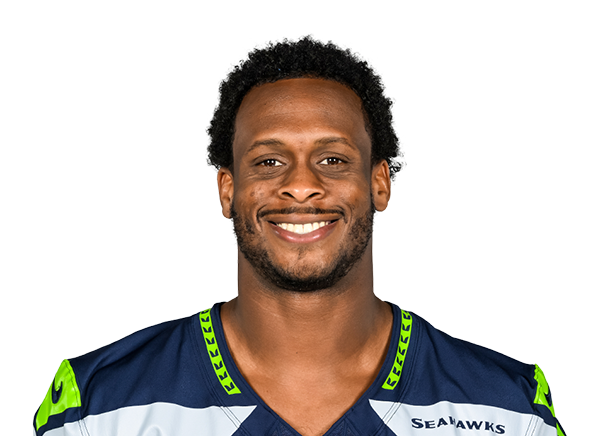 Geno Smith  QB · NYJ | 56 | Starter | +0.05552 | +3.878 | 7.665 | 4.1%32 | 1.0%95 | 8.7%15 | 10 |
| 15 | 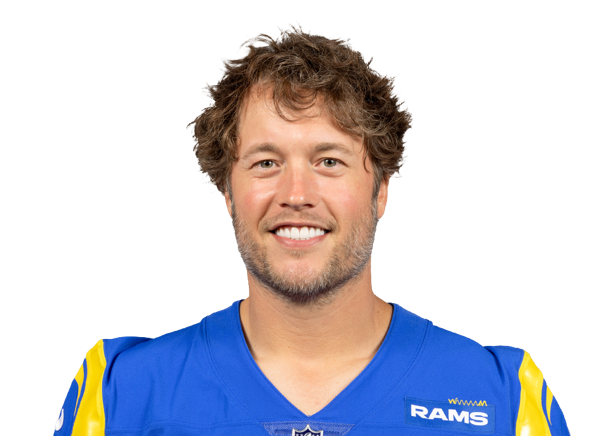 Matthew Stafford  QB · LAR | 56 | Starter | +0.09558 | +0.455 | 7.148 | 5.1%62 | 2.7%28 | 3.8%85 | 10 |
| 16 | 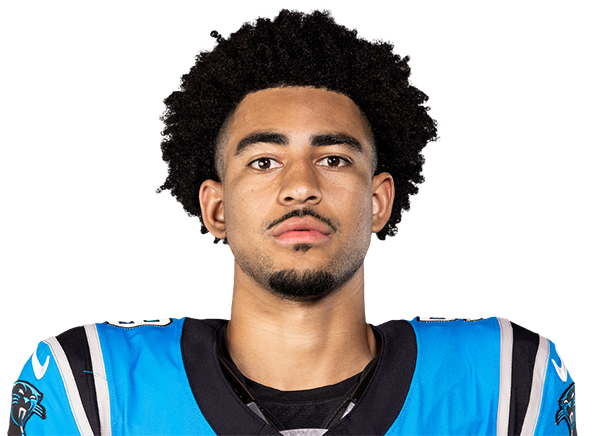 Bryce Young  QB · CAR | 48 | Depth | +0.04148 | +0.248 | 7.152 | 4.7%48 | 1.8%68 | 7.7%25 | 9 |
| 17 | 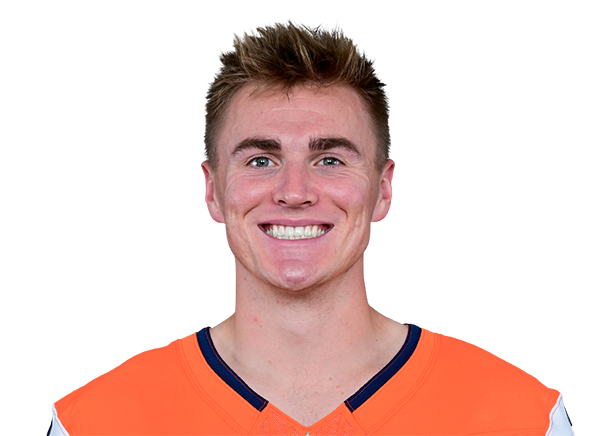 Bo Nix  QB · DEN | 47 | Depth | +0.02545 | -1.132 | 6.08 | 3.8%25 | 1.4%78 | 3.5%95 | 9 |
| 18 | 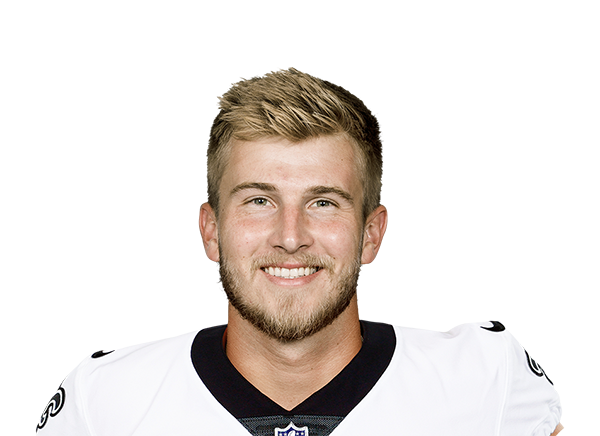 Tyler Shough  QB · NO | 41 | Depth | +0.02142 | +0.042 | 6.318 | 4.4%38 | 2.0%45 | 6.0%58 | 9 |
| 19 | 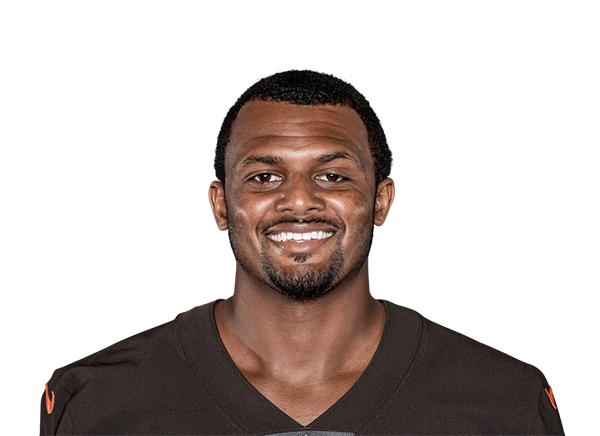 Deshaun Watson  QB · CLE | 37 | Depth | +0.00738 | -1.228 | 7.358 | 2.4%8 | 1.4%82 | 10.5%5 | 9 |
| 20 |  Jalen Hurts  QB · PHI | 36 | Depth | -0.00835 | -2.222 | 6.112 | 5.2%65 | 1.9%50 | 7.3%32 | 5 |
| 21 |  Kyler MurrayQB · MIN | 36 | Depth | -0.03122 | +2.072 | 6.628 | 3.2%22 | 1.9%50 | 8.1%22 | 6 |
| 22 |  Michael Penix Jr.  QB · ATL | 33 | Depth | -0.03618 | -5.65 | 7.155 | 4.1%35 | 2.9%15 | 4.5%72 | 8 |
| 23 |  Aaron Rodgers  QB · PIT | 32 | Depth | -0.05612 | -2.318 | 6.422 | 4.7%45 | 1.9%65 | 7.5%28 | 9 |
| 24 | 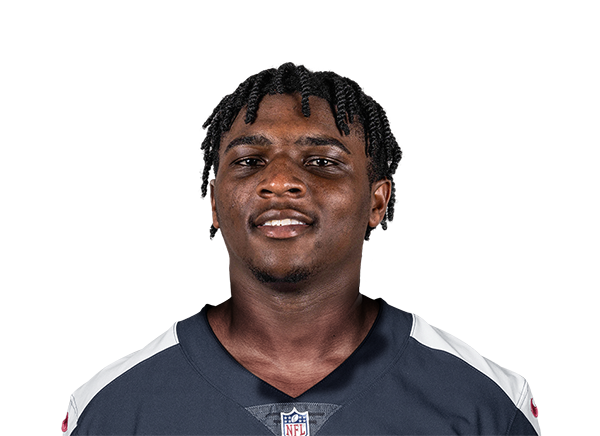 Cam Ward  QB · TEN | 31 | Depth | -0.0668 | -0.138 | 6.05 | 2.8%12 | 2.1%42 | 4.3%82 | 9 |
| 25 | 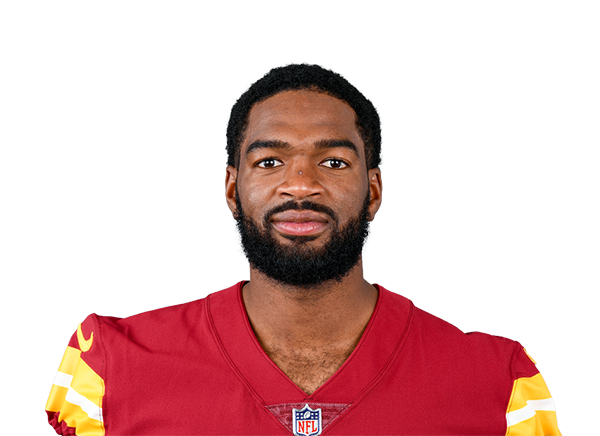 Jacoby Brissett  QB · BAL | 30 | Depth | -0.04315 | +0.145 | 5.82 | 2.8%15 | 2.3%38 | 5.5%62 | 9 |
| 26 | 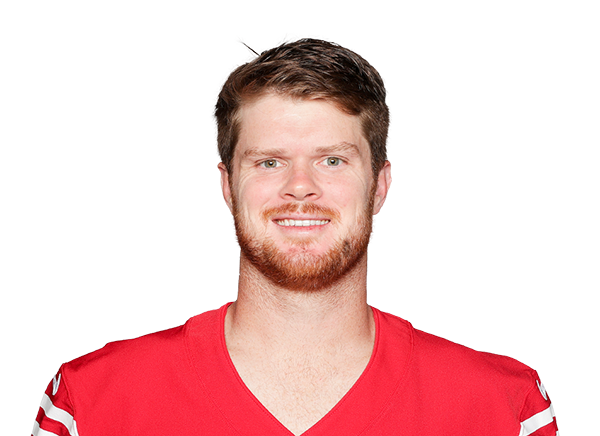 Sam Darnold  QB · SEA | 30 | Depth | -0.01132 | -2.515 | 7.038 | 4.7%52 | 4.3%5 | 7.2%35 | 7 |
| 27 | 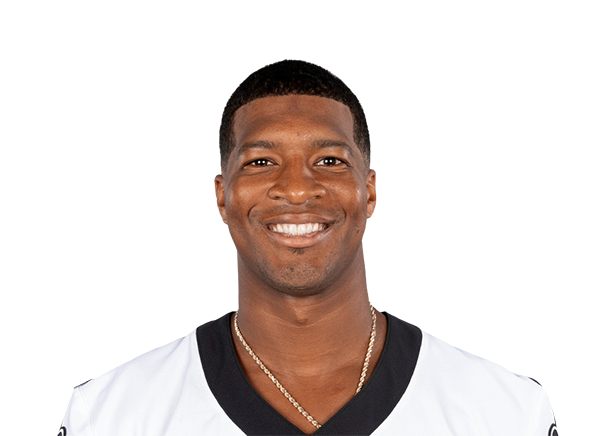 Jameis Winston  QB · NYG | 21 | Depth | -0.02725 | -6.12 | 6.215 | 4.8%55 | 3.0%12 | 8.5%18 | 8 |
| 28 | 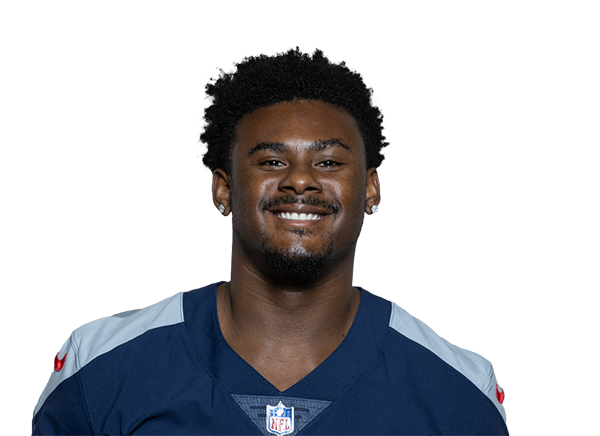 Malik Willis  QB · MIA | 19 | Depth | -0.01328 | -4.88 | 6.732 | 2.9%18 | 2.9%18 | 9.4%12 | 8 |
| 29 | 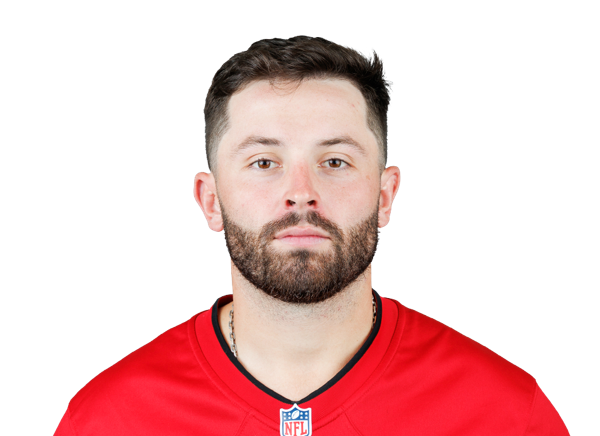 Baker Mayfield  QB · TB | 13 | Depth | -0.2032 | -1.525 | 6.525 | 2.1%2 | 2.8%22 | 10.6%2 | 6 |
| 30 | 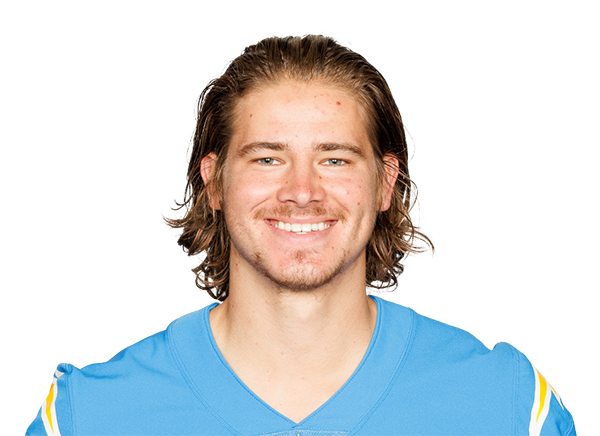 Justin Herbert  QB · LAC | 11 | Depth | -0.1825 | -3.912 | 6.835 | 2.4%5 | 4.3%2 | 10.5%8 | 9 |
Number = the player's value; the small badge is his percentile among qualified quarterbacks (90+ highlighted). Players below the volume line (80 this season) appear on their own pages but not here. Data updated 22 Nov 2026 16:37 UTC. Compare two quarterbacks →