 InjuryDante Trader Jr.: Doubtful → Out14 min ago
 Tennessee TitansGame Inactives | Week 11 Titans at Cowboys
 Baltimore RavensRookie Running Back Adam Randall Inactive vs. Panthers
 Pro Football RumorsColts Shut Down WR Alec Pierce For Remainder Of Season



- +0.105EPA/db+0.316
- +0.2CPOE+5.4
- 7.4Y/A9.0
- 6.4%TD %7.6%
2026 season · graded through week 11
Every player, graded.
Each grade is the average percentile of a player's core numbers against every qualified player at his position. Search anyone, rank any position, put any two side by side.
774players graded15elite (90+)10positions+22.9best EPA game, week 10
Players of the week · week 10
Week 10 in a nutshell →Ranked by total EPA from dropbacks, designed runs and targets: how many points each player added to his offense in one game.
1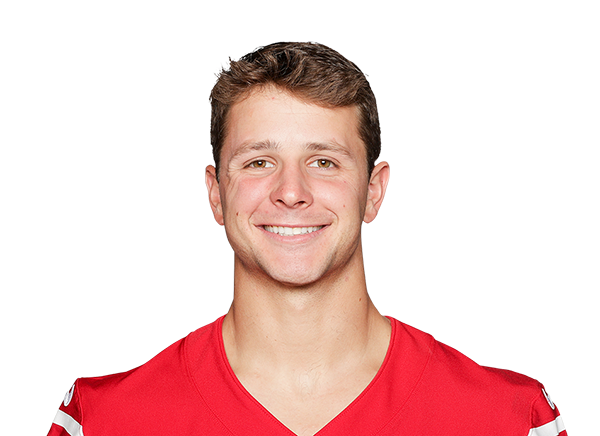
 QB · SF beat DAL 46-40Brock Purdy+22.9EPA · 36 plays22/28, 389 yds, 3 TD · 2 car, 21 yds2
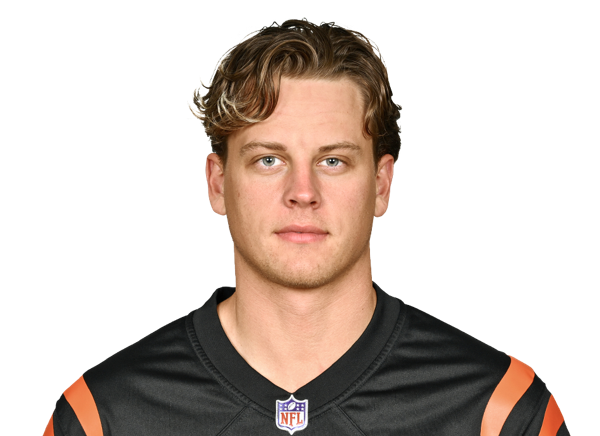
 QB · CIN beat PIT 38-18Joe Burrow+21.9EPA · 44 plays35/44, 409 yds, 4 TD3
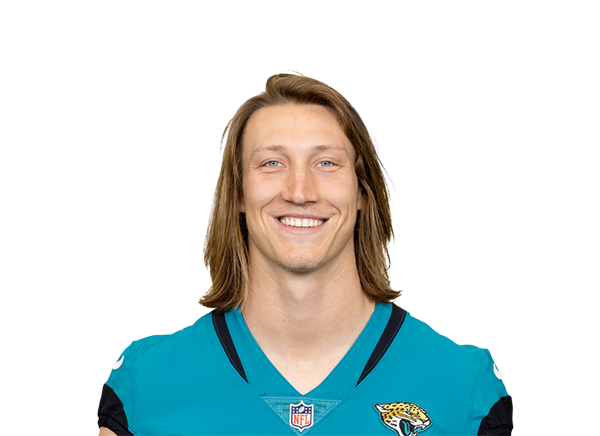
 QB · JAX beat TEN 40-23Trevor Lawrence+20.9EPA · 39 plays25/35, 352 yds, 3 TD, 1 INT · 4 car, 27 yds
QB · SF beat DAL 46-40Brock Purdy+22.9EPA · 36 plays22/28, 389 yds, 3 TD · 2 car, 21 yds2QB · CIN beat PIT 38-18Joe Burrow+21.9EPA · 44 plays35/44, 409 yds, 4 TD3QB · JAX beat TEN 40-23Trevor Lawrence+20.9EPA · 39 plays25/35, 352 yds, 3 TD, 1 INT · 4 car, 27 yds- 4
 Christian McCaffreyRB · SF · 4 rec, 161 yds, 2 TD · 13 car, 62 yds, 1 TD+14.2
- 5
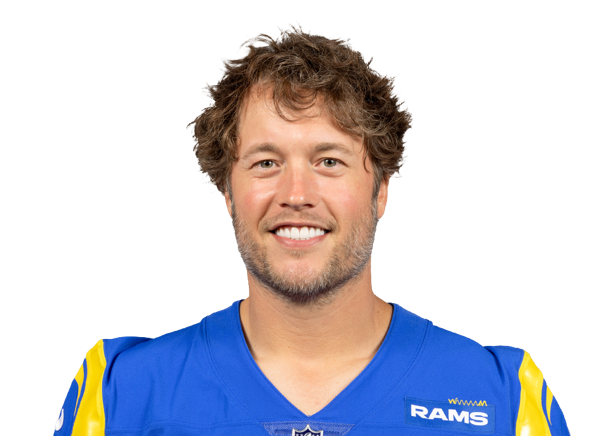 Matthew StaffordQB · LAR · 18/26, 249 yds, 3 TD, 1 INT+14.0
- 6
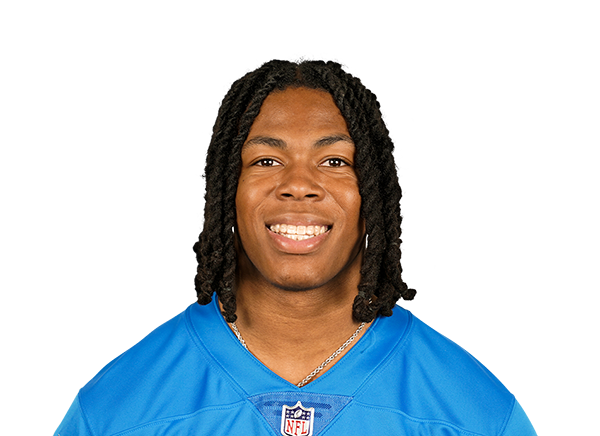 Jahmyr GibbsRB · DET · 7 rec, 99 yds · 22 car, 153 yds, 2 TD+13.3
- 7
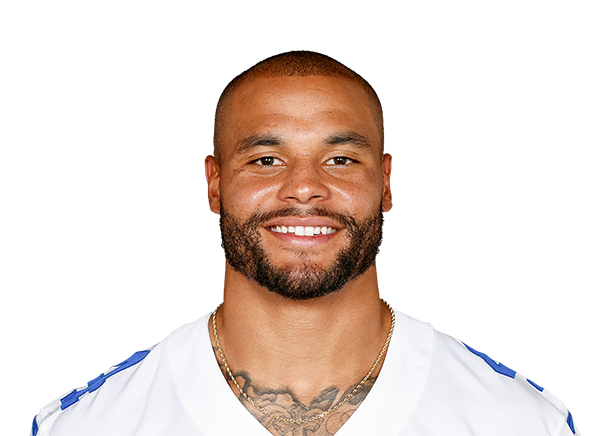 Dak PrescottQB · DAL · 30/51, 343 yds, 5 TD, 1 INT+13.3
- 8
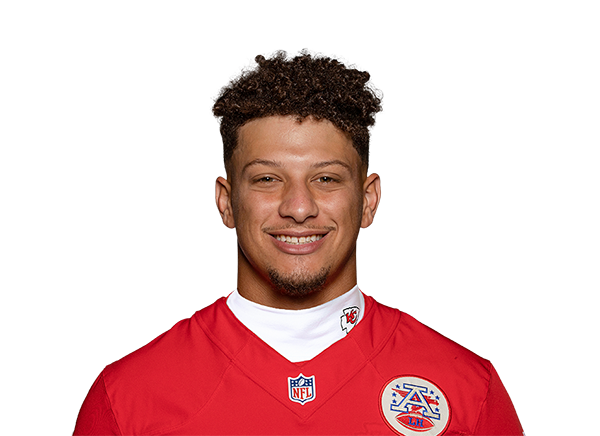 Patrick MahomesQB · KC · 22/35, 348 yds, 5 TD+13.2
- 9
 Ja'Marr ChaseWR · CIN · 11 rec, 231 yds+12.1
- 10
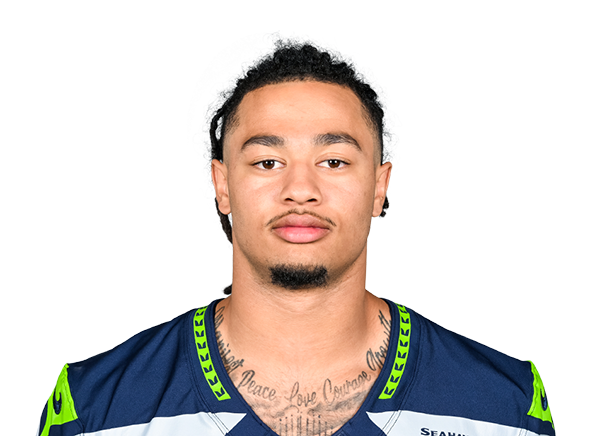 Jaxon Smith-NjigbaWR · SEA · 8 rec, 171 yds, 1 TD+10.7
- 11
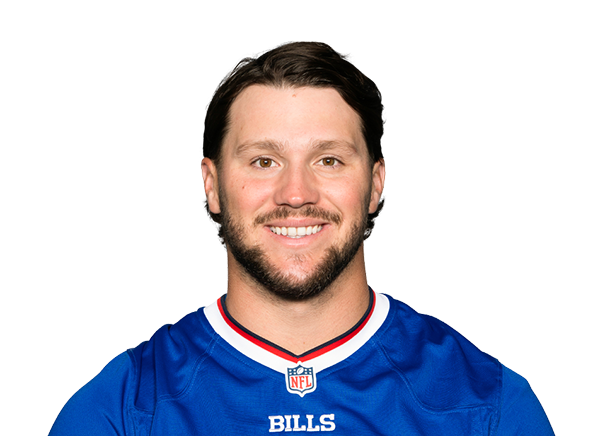 Josh AllenQB · BUF · 11/21, 196 yds, 1 TD, 1 INT+8.8
- 12
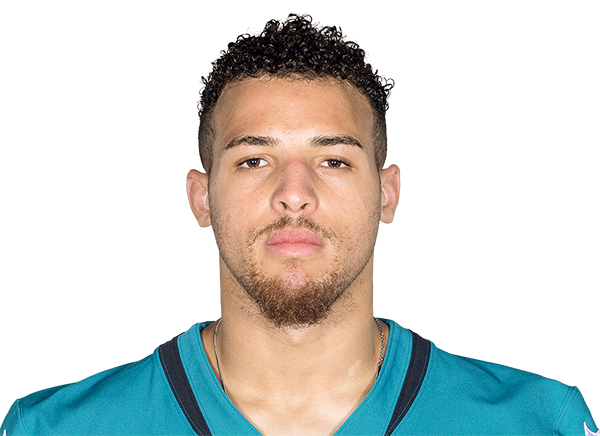 Parker WashingtonWR · JAX · 7 rec, 152 yds, 1 TD+8.5
Head to head
Compare any two →Build your own
This week's quarterback duels
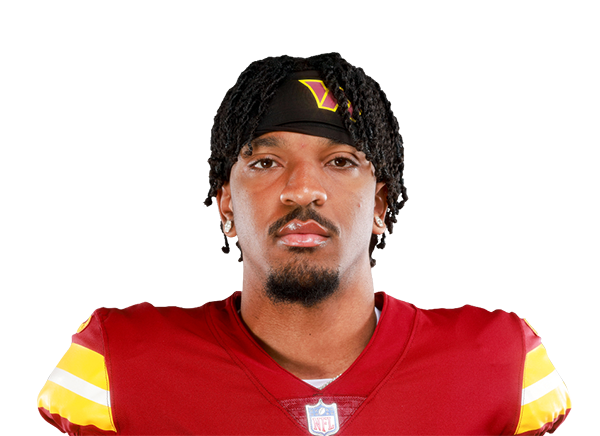
 QB · WSH
- +0.265EPA/db+0.065
- +10.5CPOE+4.1
- 8.2Y/A7.0
- 7.9%TD %4.7%
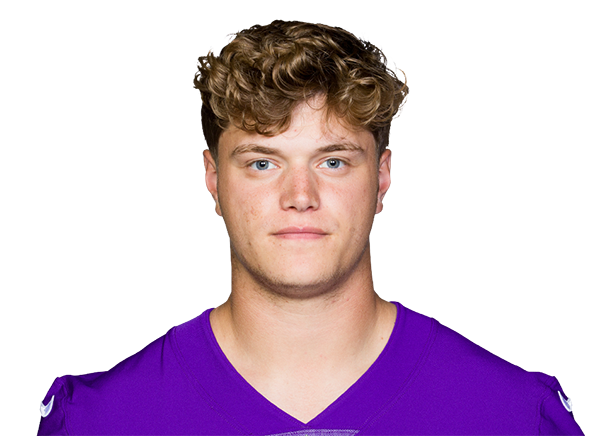
- +0.281EPA/db+0.129
- +4.2CPOE+3.3
- 8.8Y/A8.8
- 8.1%TD %1.9%
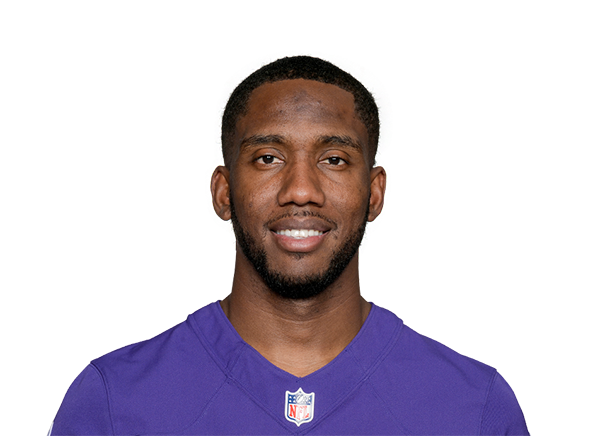
- –EPA/db+0.164
- –CPOE+1.9
- –Y/A8.0
- –TD %6.4%
Best against best
- +0.316EPA/db+0.265
- +5.4CPOE+10.5
- 9.0Y/A8.2
- 7.6%TD %7.9%
- 10.9 tgt/gTgt/g9.7 tgt/g
- 120.7 yds/gYds/g97.6 yds/g
- 11.1Yds/tgt10.1
- 72%Catch %74%
- 111.1 yds/gRush/g79.9 yds/g
- 5.0YPC5.7
- +0.030EPA/car+0.070
- 49%Success47%
- 9.0 tgt/gTgt/g6.9 tgt/g
- 84.5 yds/gYds/g61.9 yds/g
- 9.4Yds/tgt9.0
- 69%Catch %71%
- 77%Snap %83%
- 44 tklTkl/g34 tkl
- 11.5 sacksSacks5.5 sacks
- 15 TFLTFL10 TFL
- 90%Snap %94%
- 39 tklTkl/g42 tkl
- 14 PDPD7 PD
- 2 INTINT1 INT
Every position, ranked
Top five by grade · bars = percentile of each core number- 1Brock PurdySF · 2,369 pass yds · +0.32 EPA/db86
- 2Joe BurrowCIN · 2,795 pass yds · +0.26 EPA/db86
- 3Trevor LawrenceJAX · 2,284 pass yds · +0.28 EPA/db82
- 4Patrick Mahomes
 KC · 2,385 pass yds · +0.16 EPA/db81
- 5
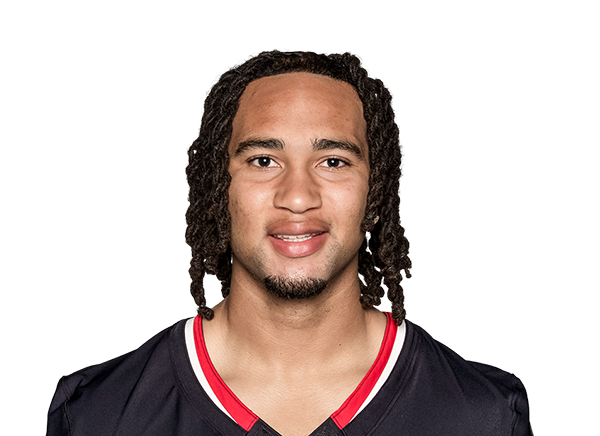 C.J. Stroud
 HOU · 2,656 pass yds · +0.16 EPA/db74
- 1Jahmyr Gibbs
 DET · 1000 rush yds · 5.0 YPC92
- 2
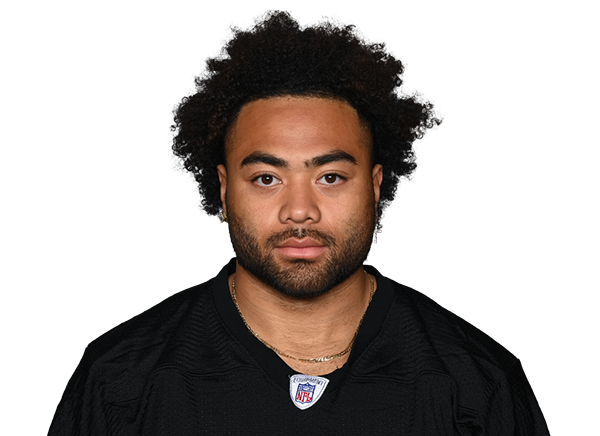 Jaylen Warren
 PIT · 719 rush yds · 5.7 YPC92
- 3
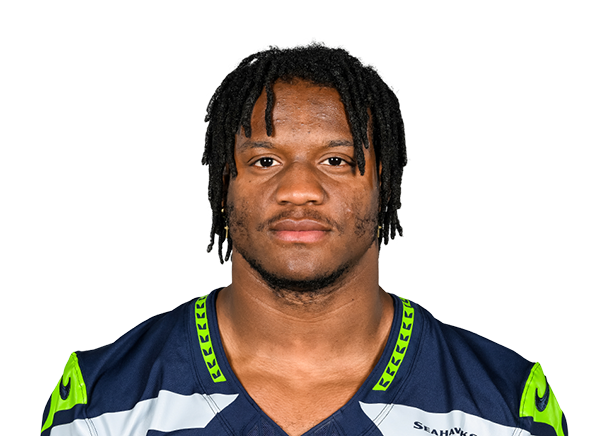 Kenneth Walker IIIKC · 872 rush yds · 5.5 YPC90
- 4Christian McCaffreySF · 519 rush yds · 4.5 YPC87
- 5
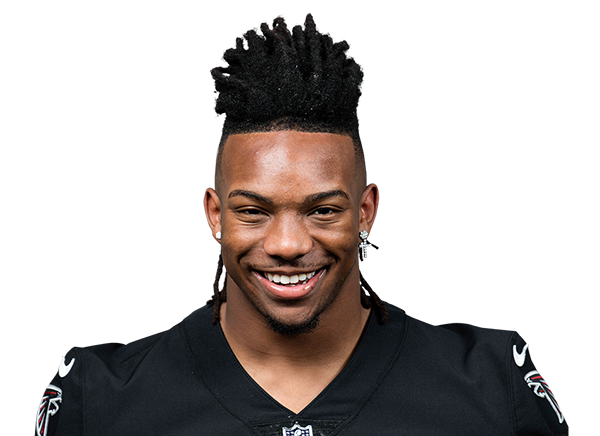 Bijan Robinson
 ATL · 951 rush yds · 5.1 YPC82
- 1Jaxon Smith-Njigba
 SEA · 1207 rec yds · 79 rec96
- 2Ja'Marr ChaseCIN · 878 rec yds · 64 rec93
- 3
 Tee HigginsCIN · 824 rec yds · 53 rec92
- 4
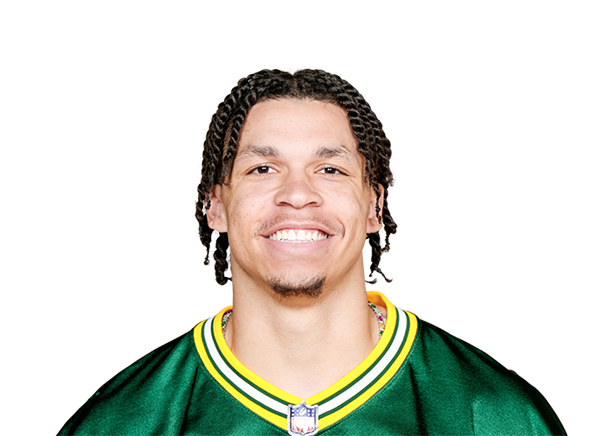 Christian Watson
 GB · 916 rec yds · 52 rec86
- 5
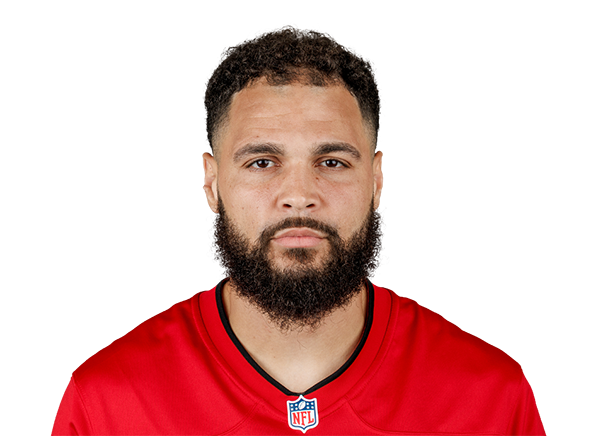 Mike EvansSF · 420 rec yds · 27 rec82
- 1
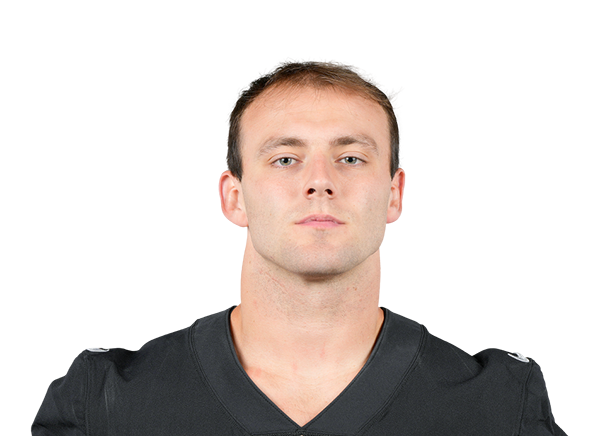 Brock Bowers
 LV · 676 rec yds · 50 rec86
- 2
 George KittleSF · 557 rec yds · 44 rec79
- 3
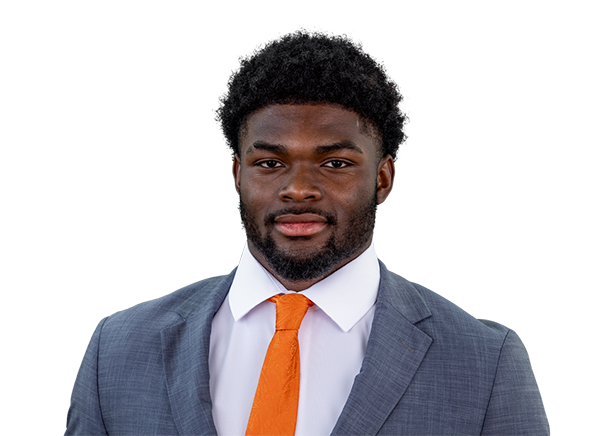 Harold Fannin Jr.
 CLE · 544 rec yds · 44 rec77
- 4
 Trey McBride
 ARI · 635 rec yds · 78 rec77
- 5
 Dalton Kincaid
 BUF · 487 rec yds · 32 rec75
- 1
 Will Anderson Jr.HOU · 11.5 sacks · 15 TFL98
- 2
 George KarlaftisKC · 5.5 sacks · 10 TFL96
- 3
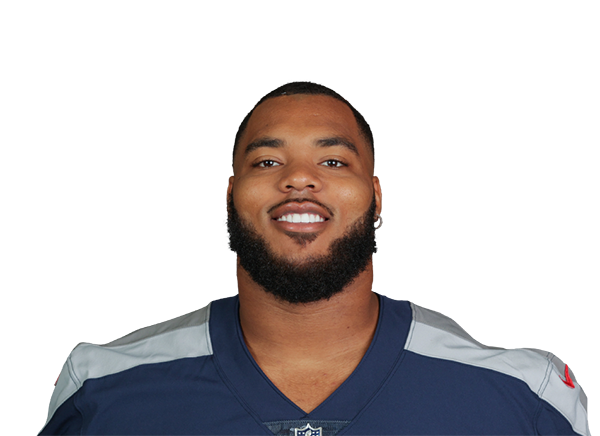 Jeffery Simmons
 CHI · 6 sacks · 9 TFL96
- 4
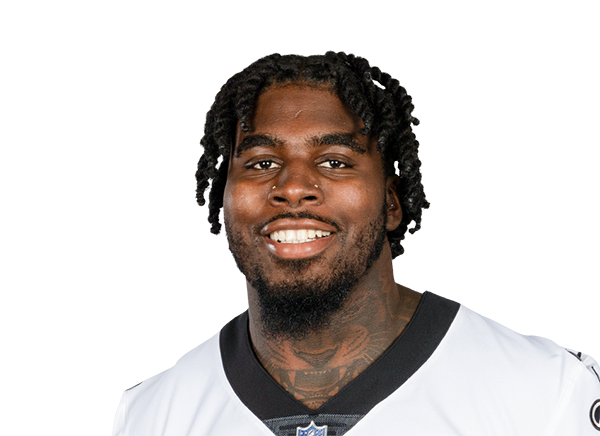 Carl Granderson
 NO · 8.5 sacks · 7 TFL93
- 5
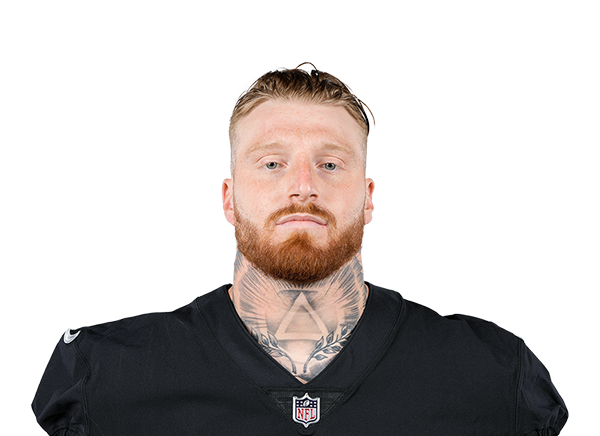 Maxx CrosbyLV · 5 sacks · 9 TFL93
- 1
 Blake Cashman
 MIN · 76 tkl · 4.5 sacks92
- 2
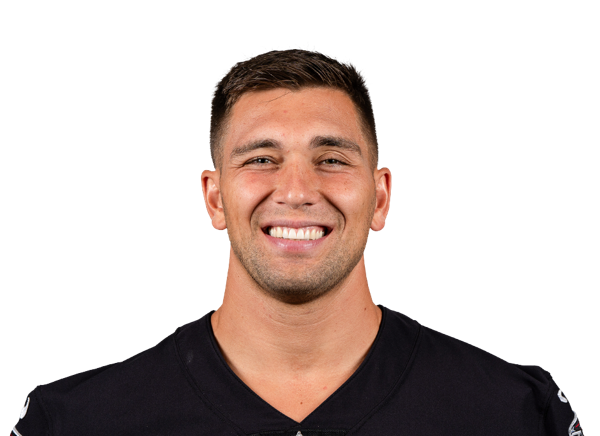 Kaden EllissNO · 56 tkl · 2 sacks90
- 3
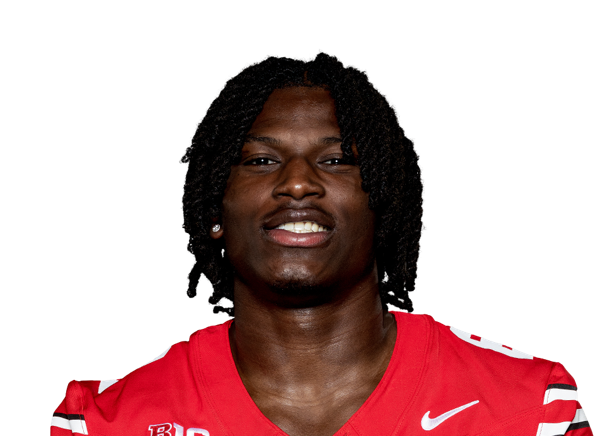 Arvell Reese
 NYG · 81 tkl · 4.5 sacks86
- 4
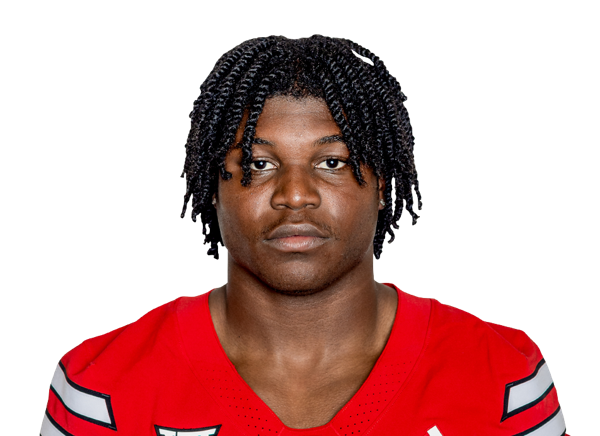 David Bailey
 NYJ · 45 tkl · 7.5 sacks81
- 5
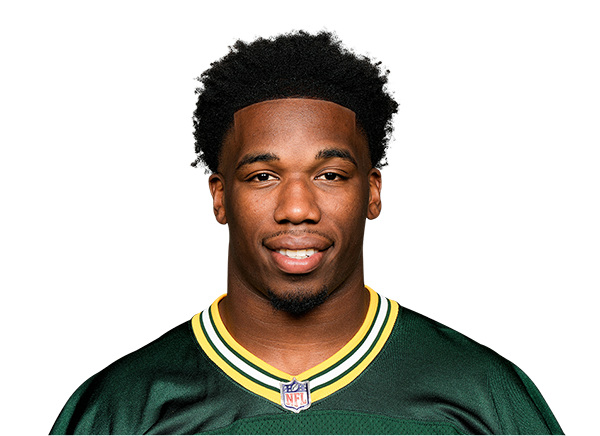 Edgerrin CooperGB · 30 tkl · 3 sacks81
- 1
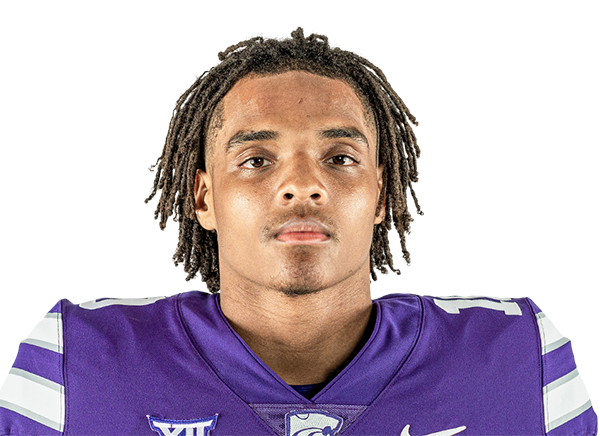 Jacob Parrish
 TB · 14 PD · 2 INT87
- 2
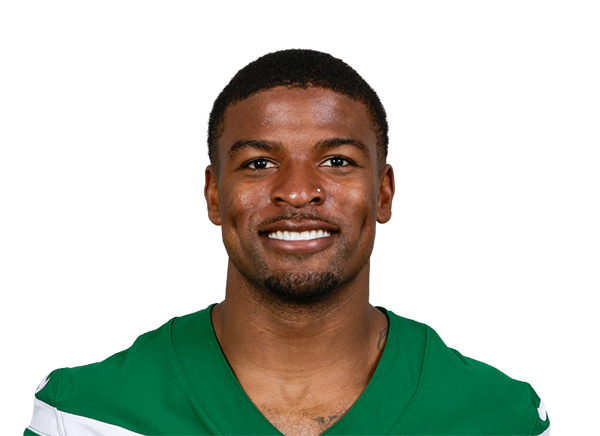 D.J. ReedDET · 7 PD · 1 INT86
- 3
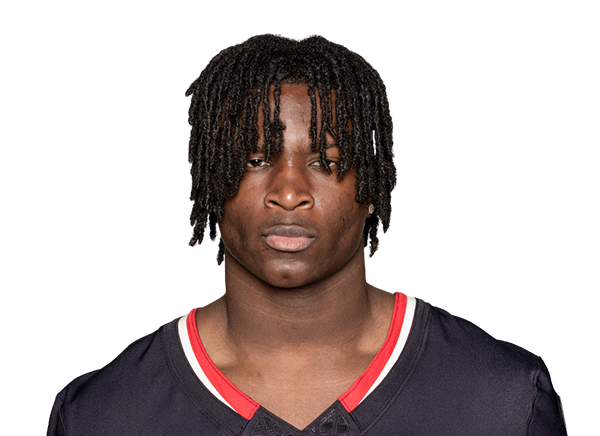 Kamari LassiterHOU · 12 PD · 1 INT86
- 4
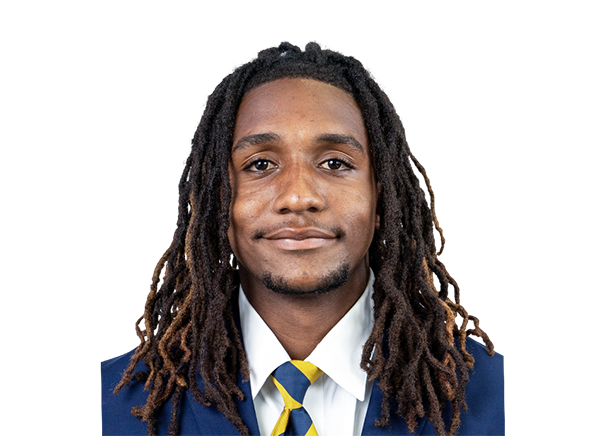 Nohl WilliamsKC · 11 PD · 2 INT86
- 5
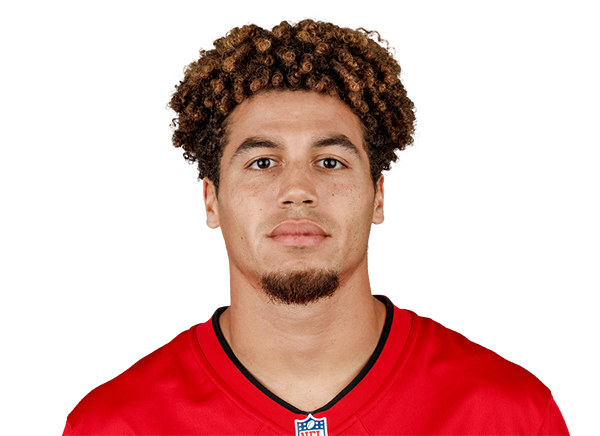 Zyon McCollumTB · 11 PD · 4 INT84
- 1
 Evan WilliamsGB · 84 tkl · 8 PD90
- 2
 Amani HookerBUF · 59 tkl · 7 PD88
- 3
 Jordan BattleCIN · 58 tkl · 8 PD86
- 4
 Jevon HollandNYG · 37 tkl · 6 PD83
- 5
 Brandon Jones
 DEN · 55 tkl · 5 PD81
- 1
 Chase McLaughlinTB · 22/22 FG · 59 long86
- 2
 Matt GayLV · 21/23 FG · 59 long75
- 3
 Ka'imi FairbairnHOU · 20/21 FG · 58 long74
- 4
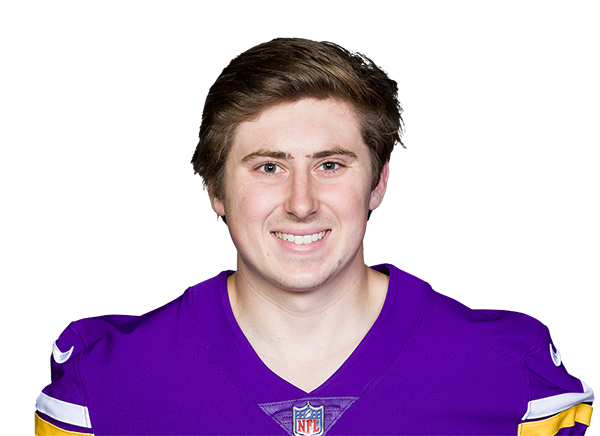 Will ReichardMIN · 23/25 FG · 56 long73
- 5
 Chad RylandARI · 22/24 FG · 60 long71
- 1
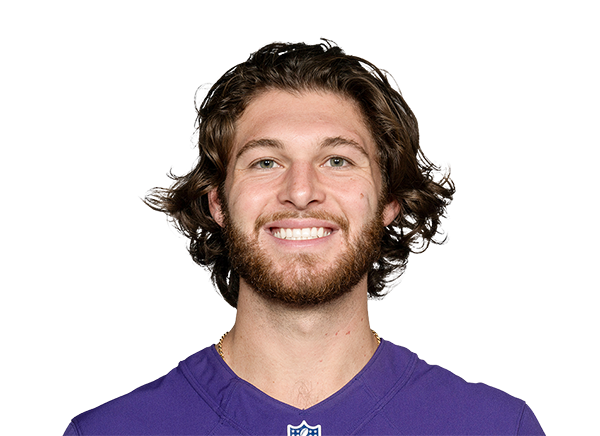 Jordan StoutNYG · 50.8 avg · 19 in 2076
- 2
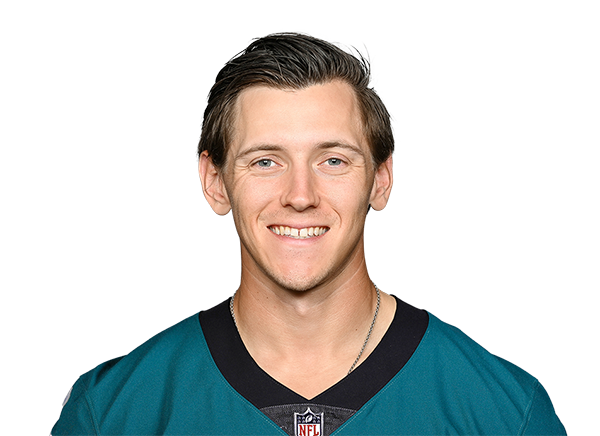 Braden Mann
 PHI · 47.5 avg · 22 in 2071
- 3
 Jeremy CrawshawDEN · 48.4 avg · 19 in 2070
- 4
 Brett ThorsonMIN · 46.4 avg · 16 in 2066
- 5
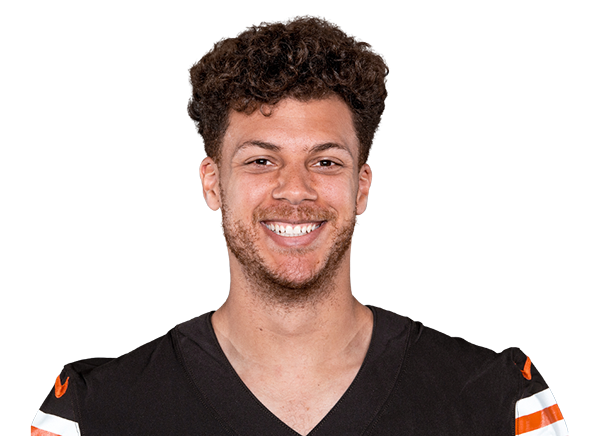 Corey BojorquezCLE · 49.9 avg · 16 in 2066
EPA per play · weeks 8-10 against weeks 1-7
Hot and cold
Heating up
 Matthew GoldenWR · GB · 32 plays lately+0.40+0.10 → +0.50
- Christian McCaffreyRB · SF · 39 plays lately+0.39+0.09 → +0.48
- Tee HigginsWR · CIN · 24 plays lately+0.31+0.60 → +0.91
 Kaelon BlackRB · SF · 24 plays lately+0.25-0.14 → +0.10
 Amon-Ra St. BrownWR · DET · 24 plays lately+0.24+0.24 → +0.48
- Brock PurdyQB · SF · 69 plays lately+0.21+0.26 → +0.46
Cooling off
 Carson WentzQB · MIN · 25 plays lately-0.80+0.07 → -0.74
 Garrett WilsonWR · NYJ · 26 plays lately-0.57+0.37 → -0.21
 Michael Penix Jr.QB · ATL · 113 plays lately-0.40+0.14 → -0.26
 Jonathan TaylorRB · IND · 51 plays lately-0.31-0.00 → -0.31
 Daniel JonesQB · · 98 plays lately-0.27-0.09 → -0.36
 Tetairoa McMillanWR · CAR · 25 plays lately-0.26+0.37 → +0.11
↳Bottom lineMatthew Golden has added +0.40 EPA per play over the last three weeks compared with his first 7, the biggest jump among regulars; Carson Wentz has dropped the most (-0.80). Three weeks is a small sample: treat it as form, not a new level.
?How to read this chart
- Bars
- EPA per play in each week of the season. Above the line = the offense gained expected points on his plays; below = it lost them. The brighter bars are the last three weeks.
- The number
- Last three weeks minus the weeks before, in EPA per play. Plays = dropbacks for QBs (scrambles included), designed runs and targets for everyone.
- Who qualifies
- At least 24 plays in the last three weeks and 40 before them, so a single big game does not make the list.
How the league grades
Qualified players by tier and position↳Bottom lineGrades are percentiles, so roughly one qualified player in ten lands in the elite tier at every position; this week the running backs have the largest elite share (3 of 51). A grade compares a player only with his own position.
?How to read this chart
- Each bar
- All qualified players at one position, split by tier. Click a bar for the full ranking.
- Qualified
- Enough volume for the position so far: 12 dropbacks a week for QBs, 4.5 carries for backs, 2.5 targets for receivers (2 for tight ends), 15 defensive snaps a week for defenders.
- Grade
- The average percentile of the core numbers listed on each board, from 1 to 99.
Grades use regular-season play-by-play (nflverse model) and ESPN box scores, recomputed every 15 minutes. Offensive linemen and long snappers are not graded: there is no individual box score to grade them on. Methodology · What EPA means