 Commanders DeskCommanders lost to the Rams 20-13 and the snaps say the margin should have been wider7 min ago
 Chiefs DeskChiefs beat the Jets 35-12 and the snaps say the margin was no accident17 min ago
 Cardinals DeskCardinals lost at Seattle on the snaps as well as the scoreboard18 min ago
 Broncos DeskBroncos beat Panthers 26-21 in a game the snaps gave to Carolina27 min ago
 Dallas CowboysMailbag: Should a trade be made before deadline?
 Tampa Bay Buccaneers2026 Bucs NFL Power Rankings Week 10
 Jacksonville JaguarsNFL Power Rankings, Week 10: Staying Strong at No. 1
 Cleveland BrownsEnter for a chance to win tickets to Browns vs. Falcons by Take a Minute, Make a Plan, Never Drive Impaired
 Baltimore RavensLate for Work: Two Reasons to Be Optimistic About Ravens' Playoff Hopes
 Texans DeskTexans earned 44-22 win over Chargers, and the snaps say it was no fluke57 min ago
 Cincinnati BengalsBengals Release Uniform Combination for White Bengal Against Steelers
 Green Bay PackersInbox: Good football teams need wins like this
 Panthers DeskPanthers outplayed Denver and lost 26-21 on a late strip sack1 h ago
 New Orleans SaintsFive things to know about the New Orleans Saints for Tuesday, November 10
 Lions DeskLions earned 19-9 in Miami, with a defense doing the work and a thin offense1 h ago
 ESPNDoes Puka Nacua's injury put the Rams' season in jeopardy?
 Bills DeskBills earned a 23-6 win in Minnesota despite a 40 percent success rate1 h ago
 Atlanta FalconsKevin Stefanski says 'all of us have to step up' after Jessie Bates trade
Compare players
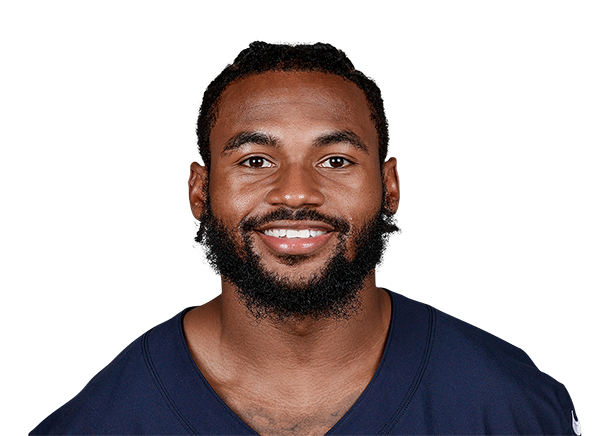 D'Andre SwiftRB · CHI
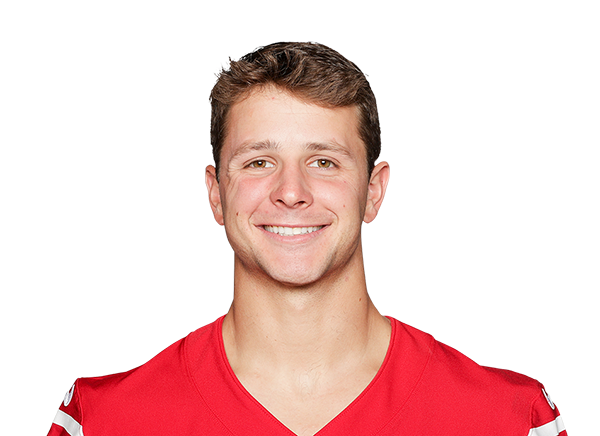 Brock PurdyQB · SF
 Chicago Bears
D'Andre Swift
Georgia · 2020 draft, round 2, pick 35
 San Francisco 49ers
Brock Purdy
Iowa State · 2022 draft, round 7, pick 262
Across the 12 shown metrics with numbers for at least two players (2026 season): Swift leads in 6 and Purdy leads in 6. A count of who is ahead, not a verdict: the metrics overlap and do not weigh the same.
Usage
SwiftPurdyPercentile chips: vs 92 RBs who played half the games, 2026 season
Passing
SwiftPurdyPercentile chips: vs 35 QBs who have 12+ dropbacks a week, 2026 season
Rushing
SwiftPurdyPercentile chips: vs 54 RBs who have 4.5+ carries a week, 2026 season
Receiving
SwiftPurdyPercentile chips: vs 20 RBs who have 2.5+ targets a week (tight ends 2+), 2026 season
Advanced metrics17 more · tap to open
Usage
Passing
Rushing
Receiving
Advanced rows are not part of the “metrics led” count. Pick exactly what you want under “Choose”.
Expected points added across every role (passing, rushing, receiving) in the nflverse play-by-play model, in the period you picked. Lines run the total; a missing bar is a week without plays. The dot marks the best week among the 2 players.
Matchups to start with
top passers · most targetedBox score totals from ESPN (regular season and playoffs; “last 4” is each player's four most recent games with a box score line). EPA, success rate, CPOE, aDOT, target and air-yard share from the nflverse play-by-play over the same games; snap share from nflverse snap counts. EPA per dropback includes sacks and scrambles. Carries are the official ESPN rush attempts; EPA per designed run leaves out quarterback scrambles (they count as dropbacks) and kneel-downs, so for a quarterback the two counts differ. Per opportunity divides counting stats by nflverse dropbacks (passing), ESPN targets (receiving) and ESPN carries (rushing); other counts go per game. Percentiles rank each value among players at the same position with enough volume in the same period (the same groups as the player cards: QBs 12 dropbacks a week, RBs 4.5 carries, wide receivers 2.5 targets, tight ends 2, defenders half the games; fewer than 8 peers, no percentile). The bars compare the players on the page only, not the league.