 InjuryA.J. Brown: Out → Questionable28 min ago
 ESPNBroncos say trade with Chargers for LB Henley 'will not be finalized'
 ESPNRams optimistic about Davante Adams' return after quiet trade deadline
 InjuryChristian Darrisaw: Active → Cleared7 h ago
 InjuryDaniel Jones: Active → Cleared7 h ago
 ESPN49ers face questions at corner heading into Week 10
 InjuryChamarri Conner: Active → Cleared7 h ago
 InjuryTrey McBride: Active → Cleared7 h ago
 Cincinnati BengalsQuick Hits | Joe Burrow Eyes Drew Brees' Record Of 74.4%: 'That Would Be A Fun One To Break'
 Pro Football RumorsNFL Practice Squad Updates: 11/11/26
 ESPNTitans explain decision to keep Tony Pollard
 Pro Football RumorsMinor NFL Transactions: 11/11/26
 Las Vegas RaidersGutierrez: Raiders long-term plan comes to fruition with insertion of Fernando Mendoza at quarterback
Browns lose in overtime as the run game stalls and the defense sacks T.Shough five times
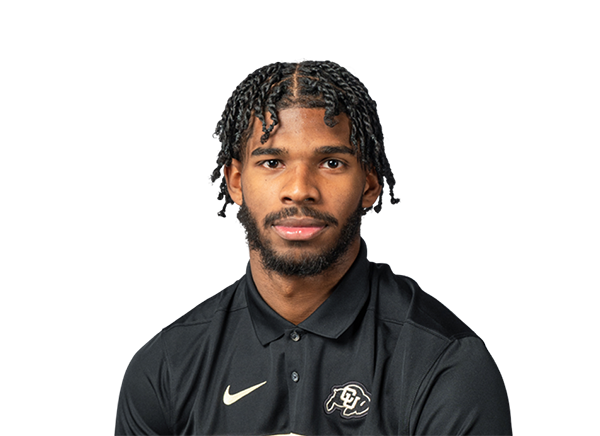
Shedeur Sanders threw for 297 yards and two touchdowns, but a 33 percent success rate and 2.8 yards per rush cost Cleveland at New Orleans.

 The TapeL 22–23at
 SAINTSQBShedeur SandersBy Browns Desk, Pigskin NightlyNov 8, 6:00 PM ET3 min read
The deciding stretch
The Saints answered the Browns' overtime touchdown with seven points of their own, and Cleveland lost 23-22 at the Caesars Superdome. The overtime score came with 1:00 left on the clock. Harold Fannin Jr. caught a 39-yard touchdown from Shedeur Sanders, and the two-point try that followed fell incomplete.
That miss left the margin at six, and the Saints took it from there. The Browns scored 6 in overtime and New Orleans scored 7.
Regulation had its own late turns. With 1:16 left in the fourth quarter, T.Shough hit C.Olave for 33 yards to the Cleveland 10. The Browns lost 29 percentage points of win probability on that one throw. A.Szmyt then made a 51-yard field goal with 0:08 left, which moved the Browns 28 points back the other way and forced the extra period.
The swing
The largest regulation swing for Cleveland came at 5:21 of the fourth quarter. Sanders threw deep right to KC Concepcion for a 64-yard touchdown, worth 38 points of win probability. It was the longest play of the day for the Browns and one of two touchdown drives they put together.
Everything else on offense was a grind. Cleveland converted 8 of 18 third downs, went 0-for-2 on fourth down and went 0-for-2 in the red zone. The Saints got into the red zone five times and scored on two of them, so neither team finished drives well.
The ground game is where the day got away from them. The Browns ran for 95 yards at 2.8 per carry. New Orleans ran for 160 yards at 5.0, and picked up 10 of its 21 first downs on the ground against 4 rushing first downs for Cleveland.
Who moved the needle
The passing game carried the offense. Sanders went 19 of 31 for 297 yards, 9.6 per attempt, with two touchdowns and no interceptions. His passer rating was 114.6. He was also sacked five times for 37 yards, and he ran 10 times for 28 yards.
EPA, or expected points added, measures how many points a play adds or costs against the average result from that spot on the field. By that measure Concepcion led the Browns at 6.1 over six plays. Fannin added 4.3 on two plays, and Denzel Boston added 4.2 on eight. Boston caught 6 passes for 98 yards, and Jerry Jeudy had 2 for 37.
The backs were the drag. Quinshon Judkins carried 15 times for 43 yards and finished at minus 6.3 EPA. Dylan Sampson had 8 carries for 21 yards and minus 2.8. As a team, Cleveland posted minus 0.405 EPA per rush, against minus 0.015 for New Orleans. The Browns' overall success rate was 33 percent to the Saints' 44.
The front did its part. The Browns sacked T.Shough five times for 29 yards. Carson Schwesinger had 15 tackles, 2 tackles for loss, 2 sacks and 2 quarterback hits. Myles Harden also had 2 sacks and 2 hits, along with a pass defensed. Ronnie Hickman broke up two passes. The pressure kept New Orleans to 5.9 yards per pass, but the run defense gave back what the sacks won.
Where it leaves them
Cleveland is 5-4 and has lost two straight. Its points-for and points-against stand at 161 and 196, a differential of minus 35. The Browns sit eighth in the conference and third in the AFC North, behind Cincinnati and Pittsburgh at 6-2 each and ahead of Baltimore at 4-5.
Their home results have been clean so far, three wins in three games. Away from Cleveland they have won twice in six tries.
The Browns host the Houston Texans on Sunday, Nov. 15, at 1:00 PM ET on Fox. Cleveland will need to move the ball on the ground at better than 2.8 yards a carry to stay ahead of the chains. Against New Orleans, the Browns stayed on schedule on one play in three.