 InjuryTommy Townsend: Questionable → Activejust now
 InjuryJustin Walley: Questionable → Activejust now
 InjuryPatrick Mahomes: Questionable → Activejust now
 InjuryT.J. Hockenson: Active → Questionablejust now
 InjuryJared Goff: Active → Questionablejust now
 Saints DeskSaints offense sits 22nd in EPA per play heading into Panthers game16 min ago
 Green Bay PackersPackers QB Jordan Love goes back-to-back as FedEx Air and Ground Player of Week
 Dolphins DeskDolphins offense found its footing in Week 7 and lost it by Week 925 min ago
 Broncos DeskBroncos defense is giving back ground just as the offense finds its footing26 min ago
 Dallas CowboysQuinnen Williams is all business in eyeing the 49ers
 Pro Football RumorsLongtime Steelers RB, Coach Dick Hoak Dies At 86
 ESPNWill McDonald to get more playing time with the Jets
Compare players
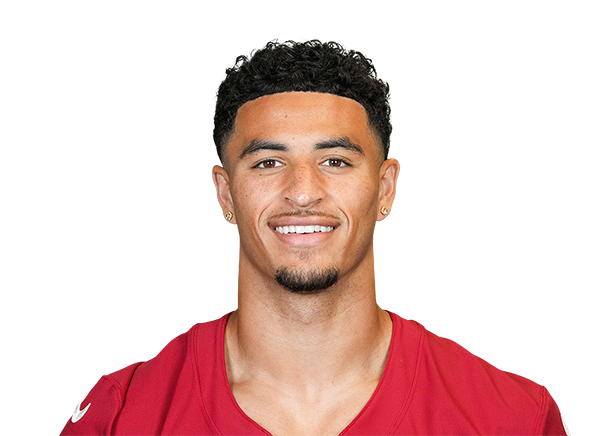 Michael WilsonWR · ARI
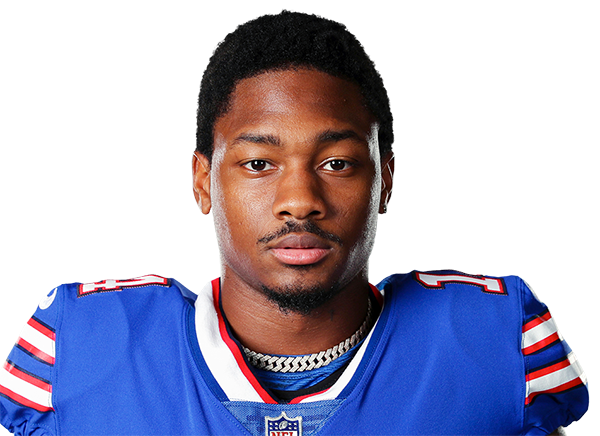 Stefon DiggsWR · WSH
 Arizona Cardinals
Michael Wilson
Stanford · 2023 draft, round 3, pick 94
Injured Reserve · Neck
 Washington Commanders
Stefon Diggs
Maryland · 2015 draft, round 5, pick 146
Across the 8 shown metrics with numbers for at least two players (last 4 games): Wilson leads in 6 and Diggs leads in 2. A count of who is ahead, not a verdict: the metrics overlap and do not weigh the same.
Usage
WilsonDiggsPercentile chips: vs 193 WRs who played half the games, last 4 games
Receiving
WilsonDiggsPercentile chips: vs 112 WRs who have 2.5+ targets a week (tight ends 2+), last 4 games
Advanced metrics6 more · tap to open
Usage
Receiving
Advanced rows are not part of the “metrics led” count. Pick exactly what you want under “Choose”.
Expected points added across every role (passing, rushing, receiving) in the nflverse play-by-play model, in the period you picked. Lines run the total; a missing bar is a week without plays. The dot marks the best week among the 2 players.
Matchups to start with
top passers · most targetedBox score totals from ESPN (regular season and playoffs; “last 4” is each player's four most recent games with a box score line). EPA, success rate, CPOE, aDOT, target and air-yard share from the nflverse play-by-play over the same games; snap share from nflverse snap counts. EPA per dropback includes sacks and scrambles. Carries are the official ESPN rush attempts; EPA per designed run leaves out quarterback scrambles (they count as dropbacks) and kneel-downs, so for a quarterback the two counts differ. Per opportunity divides counting stats by nflverse dropbacks (passing), ESPN targets (receiving) and ESPN carries (rushing); other counts go per game. Percentiles rank each value among players at the same position with enough volume in the same period (the same groups as the player cards: QBs 12 dropbacks a week, RBs 4.5 carries, wide receivers 2.5 targets, tight ends 2, defenders half the games; fewer than 8 peers, no percentile). The bars compare the players on the page only, not the league.