 Green Bay PackersMike's Mid-Week Chat | Nov. 11, 2026
 Cowboys DeskCowboys defense ranks 30th in EPA allowed, but Week 9 changed who is on the field8 min ago
 InjuryLuke Goedeke: Active → Cleared24 min ago
 Houston TexansH-Town History Is About to Light Up the Sky
 Cincinnati BengalsBengals Week 10 NFL Power Rankings Roundup
 Atlanta FalconsFalcons release kicker Nick Folk, sign Jake Moody
 Jacksonville JaguarsScout's Take: Bucky Brooks Examines Jaguars' Week 10 vs. Titans, Takeaways from 33-10 Win Over Ravens
 Minnesota VikingsDeeJay Dallas Salutes Sibling & Family History of Service
 New York GiantsInside the Numbers: Thursday Night Football Edition
 San Francisco 49ersMorning Report: Dugger and Rookies Stepping Up, Latest Rankings 🗞️
 Arizona CardinalsHow To Watch: Cardinals vs. Rams, Week 10
 Patriots DeskPatriots threw on 73% of early downs in Week 9 and the offense stalled1 h ago
 Bills DeskJosh Allen's passing efficiency has cooled while his legs still pay off1 h ago
 Indianapolis ColtsColts to celebrate military heroes during 2026 'Salute To Service' game
 Detroit LionsLIONS DAILY: Film review: Offensive and defensive takeaways from win over Dolphins
 InjuryPuka Nacua: Questionable → Doubtful1 h ago
 InjuryDeshaun Watson: Active → Out1 h ago
Compare players
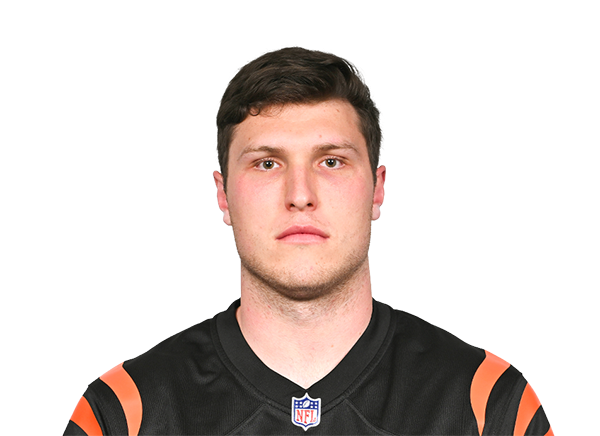 Drew SampleTE · CIN
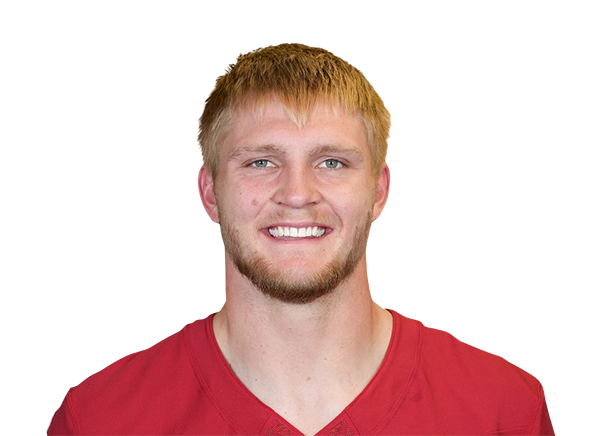 Trey McBrideTE · ARI
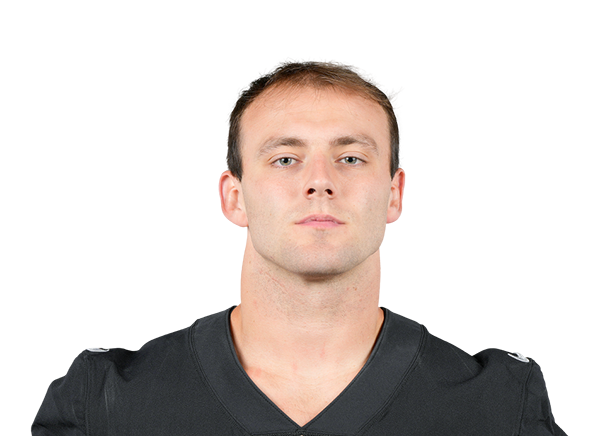 Brock BowersTE · LV
 LV
Across the 8 shown metrics with numbers for at least two players (2026 season): McBride leads in 4, Bowers leads in 3 and Sample leads in 1. A count of who is ahead, not a verdict: the metrics overlap and do not weigh the same.
Usage
Percentile chips: vs 75 TEs who played half the games, 2026 season
Receiving
Percentile chips: vs 42 TEs who have 2.5+ targets a week (tight ends 2+), 2026 season
Advanced metrics6 more · tap to open
Usage
Receiving
Expected points added across every role (passing, rushing, receiving) in the nflverse play-by-play model, in the period you picked. Lines run the total; a missing bar is a week without plays. The dot marks the best week among the 3 players.
Matchups to start with
top passers · most targetedBox score totals from ESPN (regular season and playoffs; “last 4” is each player's four most recent games with a box score line). EPA, success rate, CPOE, aDOT, target and air-yard share from the nflverse play-by-play over the same games; snap share from nflverse snap counts. EPA per dropback includes sacks and scrambles. Carries are the official ESPN rush attempts; EPA per designed run leaves out quarterback scrambles (they count as dropbacks) and kneel-downs, so for a quarterback the two counts differ. Per opportunity divides counting stats by nflverse dropbacks (passing), ESPN targets (receiving) and ESPN carries (rushing); other counts go per game. Percentiles rank each value among players at the same position with enough volume in the same period (the same groups as the player cards: QBs 12 dropbacks a week, RBs 4.5 carries, wide receivers 2.5 targets, tight ends 2, defenders half the games; fewer than 8 peers, no percentile). The bars compare the players on the page only, not the league.