 InjuryJaylinn Hawkins: Out → Questionable3 min ago
 InjuryTrent McDuffie: Out → Questionable3 min ago
 InjuryDamien Lewis: Out → Questionable3 min ago
 InjuryA.J. Brown: Out → Questionable3 min ago
 InjuryMaliek Collins: Out → Questionable3 min ago
 InjuryErik McCoy: Questionable → Doubtful3 min ago
 Dallas CowboysJerry Jones not expecting 'significant' trade for Cowboys at deadline
 Buccaneers DeskBuccaneers lost to the Bears the way the snaps said they would13 min ago
 ESPNWill the Vikings trade for a QB?
 Kansas City Chiefs10 Quick Facts Following the Chiefs Week 9 Win Over New York | Upon Further Review
 Pro Football RumorsJaguars To Retain WR Brian Thomas Jr. Past Deadline
 Tennessee TitansTuesday Mailbag: Jim Wyatt Answers Questions From Titans Fans
 Commanders DeskCommanders lost to the Rams 20-13 and the snaps say the margin should have been wider53 min ago
 Cardinals DeskCardinals lost at Seattle on the snaps as well as the scoreboard1 h ago
Compare players
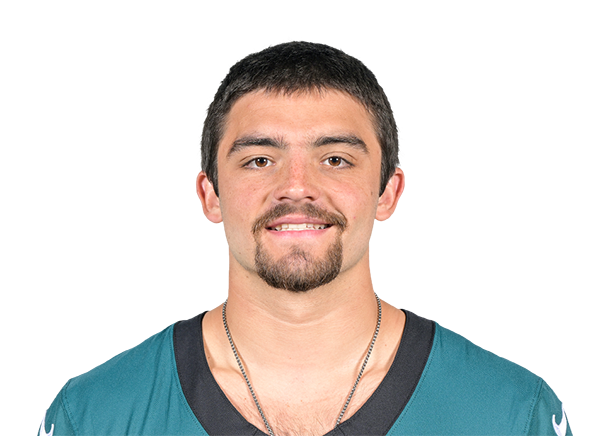 Will ShipleyRB · PHI
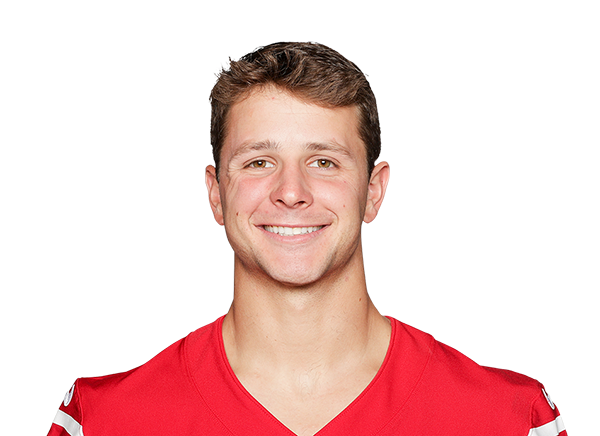 Brock PurdyQB · SF
 Philadelphia Eagles
Will Shipley
Clemson · 2024 draft, round 4, pick 127
 San Francisco 49ers
Brock Purdy
Iowa State · 2022 draft, round 7, pick 262
Across the 12 shown metrics with numbers for at least two players (2026 season): Purdy leads in 9 and Shipley leads in 3. A count of who is ahead, not a verdict: the metrics overlap and do not weigh the same.
Usage
ShipleyPurdyPercentile chips: vs 92 RBs who played half the games, 2026 season
Passing
ShipleyPurdyPercentile chips: vs 35 QBs who have 12+ dropbacks a week, 2026 season
Rushing
ShipleyPurdyReceiving
ShipleyPurdyAdvanced metrics17 more · tap to open
Usage
Passing
Rushing
Receiving
Advanced rows are not part of the “metrics led” count. Pick exactly what you want under “Choose”.
Expected points added across every role (passing, rushing, receiving) in the nflverse play-by-play model, in the period you picked. Lines run the total; a missing bar is a week without plays. The dot marks the best week among the 2 players.
Matchups to start with
top passers · most targetedBox score totals from ESPN (regular season and playoffs; “last 4” is each player's four most recent games with a box score line). EPA, success rate, CPOE, aDOT, target and air-yard share from the nflverse play-by-play over the same games; snap share from nflverse snap counts. EPA per dropback includes sacks and scrambles. Carries are the official ESPN rush attempts; EPA per designed run leaves out quarterback scrambles (they count as dropbacks) and kneel-downs, so for a quarterback the two counts differ. Per opportunity divides counting stats by nflverse dropbacks (passing), ESPN targets (receiving) and ESPN carries (rushing); other counts go per game. Percentiles rank each value among players at the same position with enough volume in the same period (the same groups as the player cards: QBs 12 dropbacks a week, RBs 4.5 carries, wide receivers 2.5 targets, tight ends 2, defenders half the games; fewer than 8 peers, no percentile). The bars compare the players on the page only, not the league.