 Green Bay PackersMike's Mid-Week Chat | Nov. 11, 2026
 San Francisco 49ersMorning Report: Dugger and Rookies Stepping Up, Latest Rankings 🗞️
 Arizona CardinalsHow To Watch: Cardinals vs. Rams, Week 10
 Patriots DeskPatriots threw on 73% of early downs in Week 9 and the offense stalled44 min ago
 Bills DeskJosh Allen's passing efficiency has cooled while his legs still pay off44 min ago
 Tampa Bay BuccaneersTampa Bay Buccaneers 50th Anniversary Opus Available Now for Pre-Order
 InjuryPuka Nacua: Questionable → Doubtful49 min ago
 InjuryDeshaun Watson: Active → Out49 min ago
 Pro Football RumorsGiants Inquired About Bijan Robinson
 ESPNBehind the Raiders' decision to trade Cousins
 Baltimore RavensLate for Work: Pundits Grade Trade for Offensive Lineman Ryan Neuzil
 New Orleans SaintsFive things to know about the New Orleans Saints for Wednesday, November 11
 Carolina PanthersKnow Your Foe: Week 10, New Orleans Saints
 InjuryEric Wilson: Active → Cleared12 h ago
 InjuryZach Allen: Active → Cleared13 h ago
Compare players
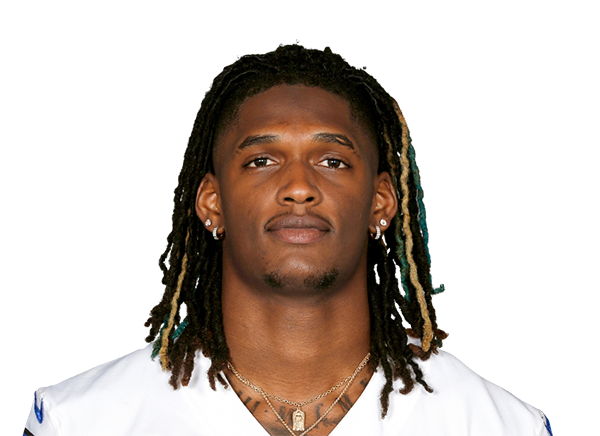 CeeDee LambWR · DAL
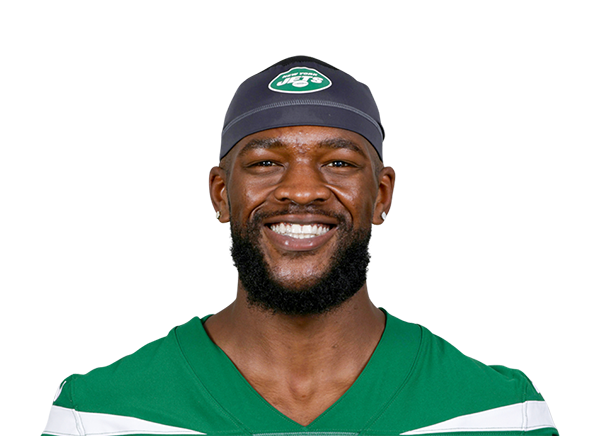 Irv CharlesWR · SEA
 Dallas Cowboys
CeeDee Lamb
Oklahoma · 2020 draft, round 1, pick 17
 Seattle Seahawks
Across the 4 shown metrics with numbers for at least two players (last 4 games): Lamb leads in 4 and Charles leads in 0. A count of who is ahead, not a verdict: the metrics overlap and do not weigh the same.
Usage
LambCharlesPercentile chips: vs 193 WRs who played half the games, last 4 games
Receiving
LambCharlesPercentile chips: vs 112 WRs who have 2.5+ targets a week (tight ends 2+), last 4 games
Advanced metrics13 more · tap to open
Usage
Receiving
Defense
Advanced rows are not part of the “metrics led” count. Pick exactly what you want under “Choose”.
Expected points added across every role (passing, rushing, receiving) in the nflverse play-by-play model, in the period you picked. Lines run the total; a missing bar is a week without plays. The dot marks the best week among the 2 players.
Matchups to start with
top passers · most targetedBox score totals from ESPN (regular season and playoffs; “last 4” is each player's four most recent games with a box score line). EPA, success rate, CPOE, aDOT, target and air-yard share from the nflverse play-by-play over the same games; snap share from nflverse snap counts. EPA per dropback includes sacks and scrambles. Carries are the official ESPN rush attempts; EPA per designed run leaves out quarterback scrambles (they count as dropbacks) and kneel-downs, so for a quarterback the two counts differ. Per opportunity divides counting stats by nflverse dropbacks (passing), ESPN targets (receiving) and ESPN carries (rushing); other counts go per game. Percentiles rank each value among players at the same position with enough volume in the same period (the same groups as the player cards: QBs 12 dropbacks a week, RBs 4.5 carries, wide receivers 2.5 targets, tight ends 2, defenders half the games; fewer than 8 peers, no percentile). The bars compare the players on the page only, not the league.