 Green Bay PackersMike's Mid-Week Chat | Nov. 11, 2026
 San Francisco 49ersMorning Report: Dugger and Rookies Stepping Up, Latest Rankings 🗞️
 Arizona CardinalsHow To Watch: Cardinals vs. Rams, Week 10
 Patriots DeskPatriots threw on 73% of early downs in Week 9 and the offense stalled14 min ago
 Bills DeskJosh Allen's passing efficiency has cooled while his legs still pay off14 min ago
 Dallas CowboysMailbag: How can the Cowboys reduce penalties?
 Tampa Bay BuccaneersTampa Bay Buccaneers 50th Anniversary Opus Available Now for Pre-Order
 InjuryPuka Nacua: Questionable → Doubtful19 min ago
 Pro Football RumorsGiants Inquired About Bijan Robinson
 ESPNBehind the Raiders' decision to trade Cousins
 Baltimore RavensLate for Work: Pundits Grade Trade for Offensive Lineman Ryan Neuzil
 New Orleans SaintsFive things to know about the New Orleans Saints for Wednesday, November 11
 Carolina PanthersKnow Your Foe: Week 10, New Orleans Saints
 InjuryEric Wilson: Active → Cleared11 h ago
 InjuryZach Allen: Active → Cleared12 h ago
Compare players
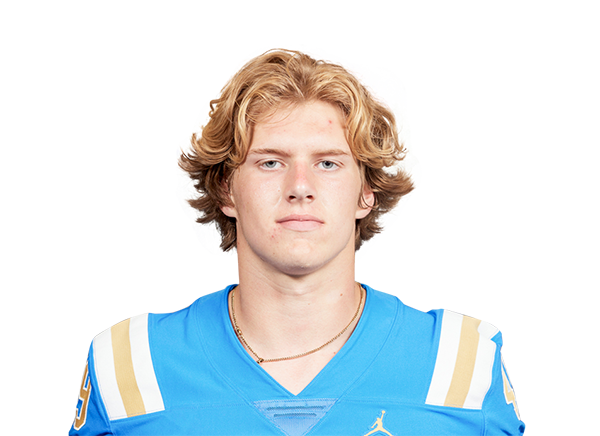 Carson SchwesingerLB · CLE
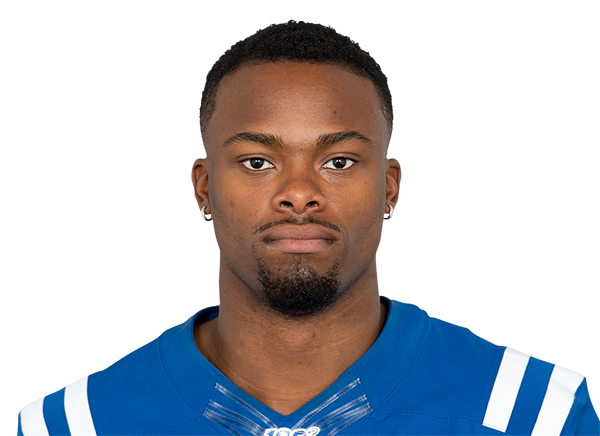 E.J. SpeedLB · HOU
 Cleveland Browns
Carson Schwesinger
UCLA · 2025 draft, round 2, pick 33
 Houston Texans
E.J. Speed
Tarleton State · 2019 draft, round 5, pick 164
Not enough numbers in this view to set Schwesinger and Speed against each other.
Usage
SchwesingerSpeedPercentile chips: vs 228 LBs who played half the games, last 4 games
Defense
SchwesingerSpeedPercentile chips: vs 233 LBs who played half the games, last 4 games
Advanced metrics2 more · tap to open
Usage
Defense
Advanced rows are not part of the “metrics led” count. Pick exactly what you want under “Choose”.
Matchups to start with
top passers · most targetedBox score totals from ESPN (regular season and playoffs; “last 4” is each player's four most recent games with a box score line). EPA, success rate, CPOE, aDOT, target and air-yard share from the nflverse play-by-play over the same games; snap share from nflverse snap counts. EPA per dropback includes sacks and scrambles. Carries are the official ESPN rush attempts; EPA per designed run leaves out quarterback scrambles (they count as dropbacks) and kneel-downs, so for a quarterback the two counts differ. Per opportunity divides counting stats by nflverse dropbacks (passing), ESPN targets (receiving) and ESPN carries (rushing); other counts go per game. Percentiles rank each value among players at the same position with enough volume in the same period (the same groups as the player cards: QBs 12 dropbacks a week, RBs 4.5 carries, wide receivers 2.5 targets, tight ends 2, defenders half the games; fewer than 8 peers, no percentile). The bars compare the players on the page only, not the league.