 Tampa Bay BuccaneersBucs vs. Lions Game Blog | Week 11 2026
 InjuryAaron Rodgers: Active → Clearedjust now
 New York GiantsLive: Highlights & updates from Giants vs. Jaguars
 ESPNWeek 11 NFL highlights: Best plays, moments, touchdowns, more
 Denver BroncosStatements from Commissioner Roger Goodell, football world on passing of Ring of Famer Tom Jackson
 Dallas CowboysStarlights: Big play tracker for Cowboys-Titans
 Pro Football RumorsPats, Cardinals, Ravens Could Pursue Daniel Jones
 InjuryTony Adams: Active → Questionable2 h ago
 InjuryMike Jackson: Questionable → Active2 h ago
 InjuryDJ Wonnum: Active → Cleared2 h ago
 Kansas City ChiefsWeek 11 Inactive Players | Cardinals vs. Chiefs
 New Orleans SaintsNew Orleans Saints inactives for Chicago Bears game | 2026 NFL Week 11
 Buffalo BillsBuffalo Bills inactives vs. Dolphins | Week 11
 49ers DeskBy the Numbers
49ers offense leads the league in EPA per play, and McCaffrey's catches are driving it
San Francisco ranks first in offensive EPA per play and in pass offense, and the last three weeks show Brock Purdy and Christian McCaffrey as receivers pushing it higher.
 SF
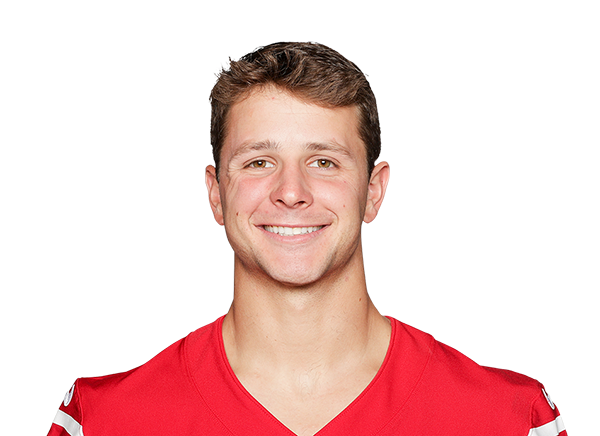 By the Numbers+0.45Offense EPA/play · Week 10QBBrock PurdyBy 49ers Desk, Pigskin NightlyNov 18, 1:00 PM ET2 min read
0.195: the offense is first in the league in EPA per play
The 49ers average 0.195 EPA per play, the best mark in the league. EPA, expected points added, is the change in a drive's expected scoring that each snap produces, so a positive average means the offense keeps leaving itself better off than it started. San Francisco's success rate is 52%.
The passing game carries it. The Niners rank first in pass offense and fourth in rush offense. Brock Purdy has 2,306 yards on 298 plays at 0.32 EPA per play with a 56% success rate, which is why the short throws are the engine and the run game is the support.
0.51: Purdy's last three weeks are 0.19 better than his season
Over the last three weeks Purdy has 596 yards on 66 plays at 0.51 EPA per play and a 64% success rate. His season mark is 0.32 and 56%. His completion percentage over expected, which compares his completions with what the throws should produce, is 10.2 over that stretch against 5.4 for the full year.
The weekly offense numbers bear that out. San Francisco posted 0.449 EPA per play in Week 10, its best week of the season, after 0.167 in Week 9. The 49ers were at 0.023 in Week 7.
2.2: McCaffrey is producing more as a receiver than as a runner
Christian McCaffrey has 8 targets in the last three weeks for 180 yards, 2.2 EPA per target and an 88% success rate. His season line as a target is 0.38 EPA per play and 60%. As a runner over the same three weeks he has 130 yards on 31 plays, 0.04 EPA per play and a 32% success rate. His season rushing line is 0.1 and 48%.
Jordan Watkins has 135 yards on 7 targets at 1.35 EPA per play and an 86% success rate. Keenan Allen has 61 yards on 7 targets at 0.6 and 71%. Mike Evans leads the season group at 0.87 EPA per play and a 70% success rate, with 500 yards on 40 targets.
George Kittle still takes the biggest share, 24% for the season and 31% over the last three weeks, but his last-three-weeks EPA per play is 0.01 against 0.23 for the season.
53%: the early-down pass rate is back near the middle
The early-down pass rate hit 64% in Week 7, fell to 41% in Week 9 and came back to 53% in Week 10. That is 23 points of swing in three games. The season opened at 50% in Week 1.
The running game is not producing at the level of the passing game. Kaelon Black has 356 yards on 79 plays at minus 0.05 EPA per play and a 42% success rate, and his last-three-weeks success rate is 32%, the same as McCaffrey's. Early-down passing is where the offense has been most efficient.
What to watch next
San Francisco is 8-1, the top seed in the conference, 5-0 at home, and it hosts the Minnesota Vikings on Sunday, Nov. 22, at 8:20 PM ET on NBC. The defense allowed 0.192 EPA per play in Week 10, its highest weekly figure of the season, and Renardo Green's snap share fell from 99% in Week 7 to 64% in Week 10 while Ephesians Prysock's rose from 3% to 36%. The cornerback snap split is the number to track on Sunday night.