 InjuryDJ Turner II: Active → Questionablejust now
 InjuryJustin Walley: Active → Outjust now
 InjuryElgton Jenkins: Active → Questionablejust now
 Pro Football RumorsRavens To Sign K Riley Patterson
 Pro Football RumorsSaints Designate RB Travis Etienne For Return; Cesar Ruiz Moving To C
 Las Vegas RaidersGame Preview: Klint Kubiak looking for Raiders offense to continue resurgence against Seahawks
 Buffalo Bills'The opportunity here is tremendous' | Amani Hooker reacts to his first day with the Bills
 Minnesota VikingsKevin O'Connell & Nolan Teasley Explain Process of Returning Kirk Cousins to Vikings
 New England PatriotsWeek 10 Injury Report: Patriots at Lions
 Houston TexansWeek 10 Injury Report | Texans at Browns
 Pittsburgh Steelers'I'm feeling good right now'
Compare players
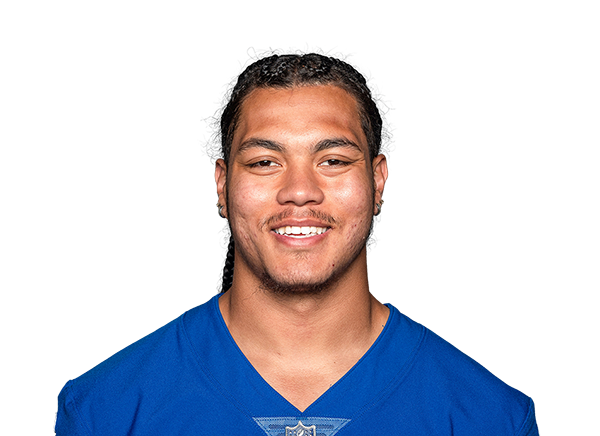 Dane BeltonS · NYJ
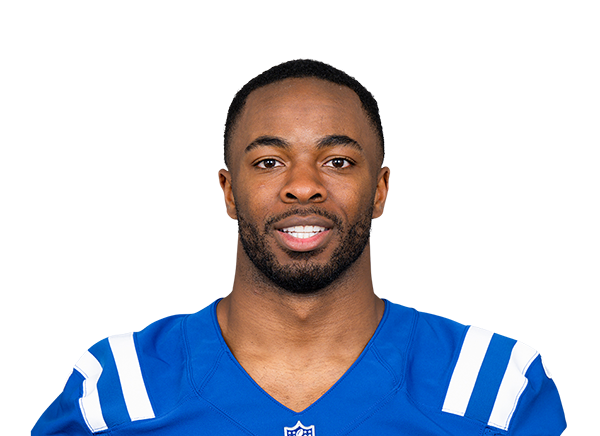 Darrell Baker Jr.CB · MIA
 New York Jets
Dane Belton
Iowa · 2022 draft, round 4, pick 114
 Miami Dolphins
Not enough numbers in this view to set Belton and Baker Jr. against each other.
Usage
BeltonBaker Jr.Percentile chips: vs 138 safeties who played half the games, last 4 games
Defense
BeltonBaker Jr.Percentile chips: vs 143 safeties who played half the games, last 4 games
Advanced metrics2 more · tap to open
Usage
Defense
Advanced rows are not part of the “metrics led” count. Pick exactly what you want under “Choose”.
Matchups to start with
top passers · most targetedBox score totals from ESPN (regular season and playoffs; “last 4” is each player's four most recent games with a box score line). EPA, success rate, CPOE, aDOT, target and air-yard share from the nflverse play-by-play over the same games; snap share from nflverse snap counts. EPA per dropback includes sacks and scrambles. Carries are the official ESPN rush attempts; EPA per designed run leaves out quarterback scrambles (they count as dropbacks) and kneel-downs, so for a quarterback the two counts differ. Per opportunity divides counting stats by nflverse dropbacks (passing), ESPN targets (receiving) and ESPN carries (rushing); other counts go per game. Percentiles rank each value among players at the same position with enough volume in the same period (the same groups as the player cards: QBs 12 dropbacks a week, RBs 4.5 carries, wide receivers 2.5 targets, tight ends 2, defenders half the games; fewer than 8 peers, no percentile). The bars compare the players on the page only, not the league.