 InjuryJ.J. McCarthy: Questionable → Active6 min ago
 InjuryMalik Willis: Questionable → Injured Reserve6 min ago
 InjuryJordan Whittington: Questionable → Injured Reserve6 min ago
 Indianapolis ColtsColts release unofficial depth chart for Week 10
 Carolina PanthersPanthers release depth chart ahead of Week 10 of the 2026 season
 ESPNNFL trade deadline grades: Deals for Kirk Cousins, Amani Hooker, Keenan Allen
 ESPNSources: Chiefs snag needed help at WR, trade for Colts' Josh Downs
 Pro Football RumorsFalcons, Ravens Swap OL Ryan Neuzil, Andrew Vorhees
 Green Bay PackersPackers announce roster move | Nov. 10, 2026
 Jets DeskJets lose 35-12 to Chiefs and the snaps agree with the scoreboard57 min ago
 Chargers DeskTexans outplayed the Chargers by three touchdowns' worth of snaps58 min ago
Compare players
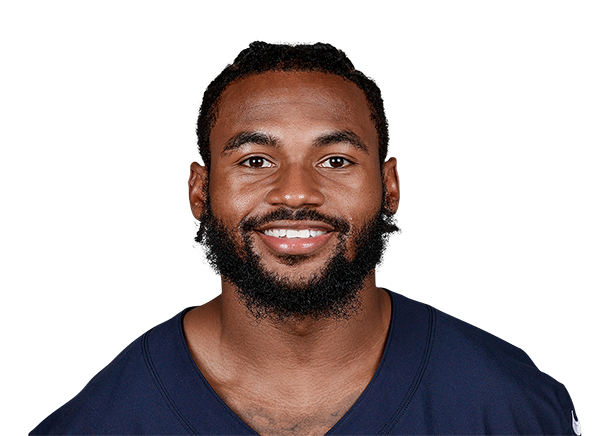 D'Andre SwiftRB · CHI
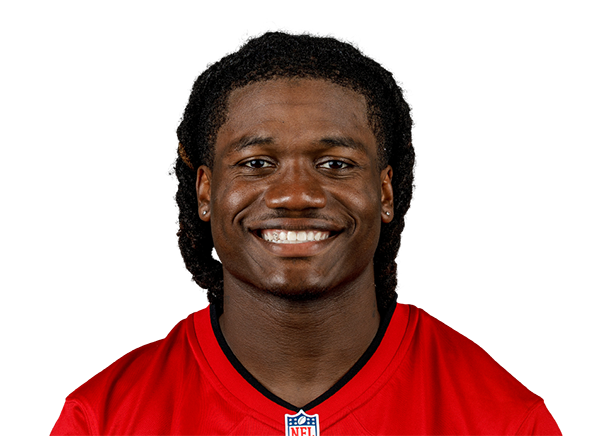 Bucky IrvingRB · TB
 Chicago Bears
D'Andre Swift
Georgia · 2020 draft, round 2, pick 35
 Tampa Bay Buccaneers
Bucky Irving
Oregon · 2024 draft, round 4, pick 125
Across the 8 shown metrics with numbers for at least two players (2026 season): Swift leads in 4 and Irving leads in 4. A count of who is ahead, not a verdict: the metrics overlap and do not weigh the same.
Usage
SwiftIrvingPercentile chips: vs 92 RBs who played half the games, 2026 season
Rushing
SwiftIrvingPercentile chips: vs 54 RBs who have 4.5+ carries a week, 2026 season
Receiving
SwiftIrvingPercentile chips: vs 20 RBs who have 2.5+ targets a week (tight ends 2+), 2026 season
Advanced metrics14 more · tap to open
Usage
Rushing
Receiving
Advanced rows are not part of the “metrics led” count. Pick exactly what you want under “Choose”.
Expected points added across every role (passing, rushing, receiving) in the nflverse play-by-play model, in the period you picked. Lines run the total; a missing bar is a week without plays. The dot marks the best week among the 2 players.
Matchups to start with
top passers · most targetedBox score totals from ESPN (regular season and playoffs; “last 4” is each player's four most recent games with a box score line). EPA, success rate, CPOE, aDOT, target and air-yard share from the nflverse play-by-play over the same games; snap share from nflverse snap counts. EPA per dropback includes sacks and scrambles. Carries are the official ESPN rush attempts; EPA per designed run leaves out quarterback scrambles (they count as dropbacks) and kneel-downs, so for a quarterback the two counts differ. Per opportunity divides counting stats by nflverse dropbacks (passing), ESPN targets (receiving) and ESPN carries (rushing); other counts go per game. Percentiles rank each value among players at the same position with enough volume in the same period (the same groups as the player cards: QBs 12 dropbacks a week, RBs 4.5 carries, wide receivers 2.5 targets, tight ends 2, defenders half the games; fewer than 8 peers, no percentile). The bars compare the players on the page only, not the league.