 InjuryMarcus Jones: Active → Cleared13 min ago
 InjuryAaron Banks: Active → Questionable13 min ago
 Pro Football RumorsRavens To Sign K Riley Patterson
 Las Vegas RaidersGame Preview: Klint Kubiak looking for Raiders offense to continue resurgence against Seahawks
 Buffalo Bills'The opportunity here is tremendous' | Amani Hooker reacts to his first day with the Bills
 Bengals DeskBengals passing tree leans on Chase and Higgins as the backfield sputters35 min ago
 Minnesota VikingsKevin O'Connell & Nolan Teasley Explain Process of Returning Kirk Cousins to Vikings
 Cleveland BrownsHaslam Sports Group continues its investment in Northeast Ohio and Columbus
 Houston TexansWeek 10 Injury Report | Texans at Browns
 Pittsburgh Steelers'I'm feeling good right now'
Compare players
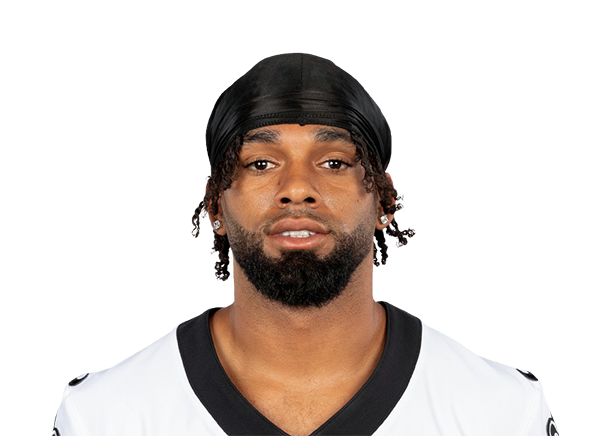 Chris OlaveWR · NO
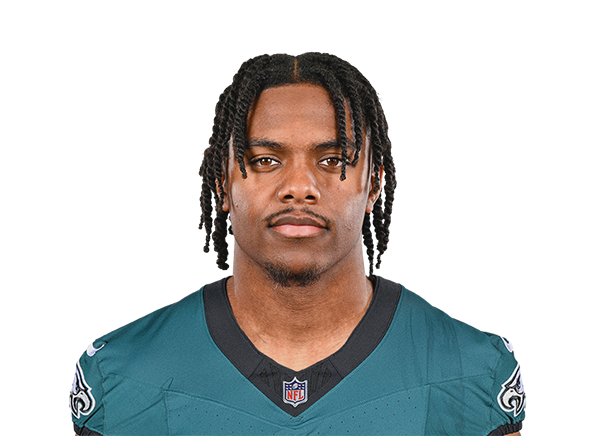 Jahan DotsonWR · ATL
 New Orleans Saints
Chris Olave
Ohio State · 2022 draft, round 1, pick 11
 Atlanta Falcons
Jahan Dotson
Penn State · 2022 draft, round 1, pick 16
Across the 8 shown metrics with numbers for at least two players (last 4 games): Olave leads in 5 and Dotson leads in 2; 1 is level. A count of who is ahead, not a verdict: the metrics overlap and do not weigh the same.
Usage
OlaveDotsonPercentile chips: vs 193 WRs who played half the games, last 4 games
Receiving
OlaveDotsonPercentile chips: vs 112 WRs who have 2.5+ targets a week (tight ends 2+), last 4 games
Advanced metrics6 more · tap to open
Usage
Receiving
Advanced rows are not part of the “metrics led” count. Pick exactly what you want under “Choose”.
Expected points added across every role (passing, rushing, receiving) in the nflverse play-by-play model, in the period you picked. Lines run the total; a missing bar is a week without plays. The dot marks the best week among the 2 players.
Matchups to start with
top passers · most targetedBox score totals from ESPN (regular season and playoffs; “last 4” is each player's four most recent games with a box score line). EPA, success rate, CPOE, aDOT, target and air-yard share from the nflverse play-by-play over the same games; snap share from nflverse snap counts. EPA per dropback includes sacks and scrambles. Carries are the official ESPN rush attempts; EPA per designed run leaves out quarterback scrambles (they count as dropbacks) and kneel-downs, so for a quarterback the two counts differ. Per opportunity divides counting stats by nflverse dropbacks (passing), ESPN targets (receiving) and ESPN carries (rushing); other counts go per game. Percentiles rank each value among players at the same position with enough volume in the same period (the same groups as the player cards: QBs 12 dropbacks a week, RBs 4.5 carries, wide receivers 2.5 targets, tight ends 2, defenders half the games; fewer than 8 peers, no percentile). The bars compare the players on the page only, not the league.