 InjuryMalik Willis: Doubtful → Injured Reserve17 min ago
 Rams DeskRams earned 20-13 win at Washington despite 4.3 luck points lost and four costly flags26 min ago
 InjuryKyler Murray: Out → Doubtful32 min ago
 InjuryGraham Barton: Active → Cleared32 min ago
 Jets DeskJets lose 35-12 to Chiefs and the snaps agree with the scoreboard35 min ago
 Chargers DeskTexans outplayed the Chargers by three touchdowns' worth of snaps36 min ago
 Jacksonville JaguarsRoster Moves: Jaguars Waive CB Alijah Huzzie
 Buffalo BillsBills land impact safety Amani Hooker in trade with Titans
 ESPNSources: Chiefs snag needed help at WR, trade for Colts' Josh Downs
 InjuryGarett Bolles: Active → Cleared50 min ago
 Dallas CowboysTape Talk: Film review from Cowboys' 27-23 win over the Colts
 Green Bay PackersPackers rookie CB Brandon Cisse has 'quite a bit of resilience about his game'
Compare players
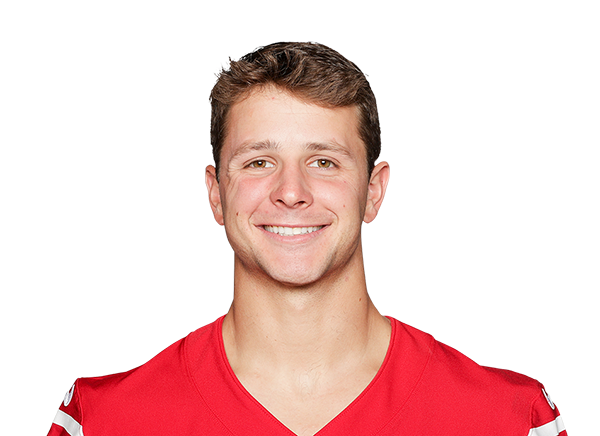 Brock PurdyQB · SF
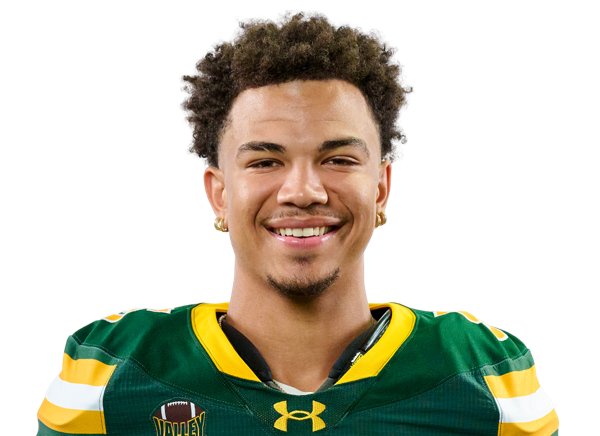 Bryce LanceWR · NO
 San Francisco 49ers
Brock Purdy
Iowa State · 2022 draft, round 7, pick 262
 New Orleans Saints
Bryce Lance
North Dakota State · 2026 draft, round 4, pick 136
Across the 10 shown metrics with numbers for at least two players (2026 season): Purdy leads in 5 and Lance leads in 5. A count of who is ahead, not a verdict: the metrics overlap and do not weigh the same.
Usage
PurdyLancePercentile chips: vs 34 QBs who played half the games, 2026 season
Passing
PurdyLancePercentile chips: vs 35 QBs who have 12+ dropbacks a week, 2026 season
Rushing
PurdyLanceReceiving
PurdyLancePercentile chips: vs 88 WRs who have 2.5+ targets a week (tight ends 2+), 2026 season
Advanced metrics16 more · tap to open
Usage
Passing
Rushing
Receiving
Advanced rows are not part of the “metrics led” count. Pick exactly what you want under “Choose”.
Expected points added across every role (passing, rushing, receiving) in the nflverse play-by-play model, in the period you picked. Lines run the total; a missing bar is a week without plays. The dot marks the best week among the 2 players.
Matchups to start with
top passers · most targetedBox score totals from ESPN (regular season and playoffs; “last 4” is each player's four most recent games with a box score line). EPA, success rate, CPOE, aDOT, target and air-yard share from the nflverse play-by-play over the same games; snap share from nflverse snap counts. EPA per dropback includes sacks and scrambles. Carries are the official ESPN rush attempts; EPA per designed run leaves out quarterback scrambles (they count as dropbacks) and kneel-downs, so for a quarterback the two counts differ. Per opportunity divides counting stats by nflverse dropbacks (passing), ESPN targets (receiving) and ESPN carries (rushing); other counts go per game. Percentiles rank each value among players at the same position with enough volume in the same period (the same groups as the player cards: QBs 12 dropbacks a week, RBs 4.5 carries, wide receivers 2.5 targets, tight ends 2, defenders half the games; fewer than 8 peers, no percentile). The bars compare the players on the page only, not the league.