 InjuryMalik Willis: Doubtful → Injured Reserve15 min ago
 Rams DeskRams earned 20-13 win at Washington despite 4.3 luck points lost and four costly flags24 min ago
 InjuryKyler Murray: Out → Doubtful30 min ago
 InjuryGraham Barton: Active → Cleared30 min ago
 Jets DeskJets lose 35-12 to Chiefs and the snaps agree with the scoreboard33 min ago
 Chargers DeskTexans outplayed the Chargers by three touchdowns' worth of snaps34 min ago
 Jacksonville JaguarsRoster Moves: Jaguars Waive CB Alijah Huzzie
 Buffalo BillsBills land impact safety Amani Hooker in trade with Titans
 ESPNSources: Chiefs snag needed help at WR, trade for Colts' Josh Downs
 InjuryGarett Bolles: Active → Cleared47 min ago
 Dallas CowboysTape Talk: Film review from Cowboys' 27-23 win over the Colts
 Green Bay PackersPackers rookie CB Brandon Cisse has 'quite a bit of resilience about his game'
Compare players
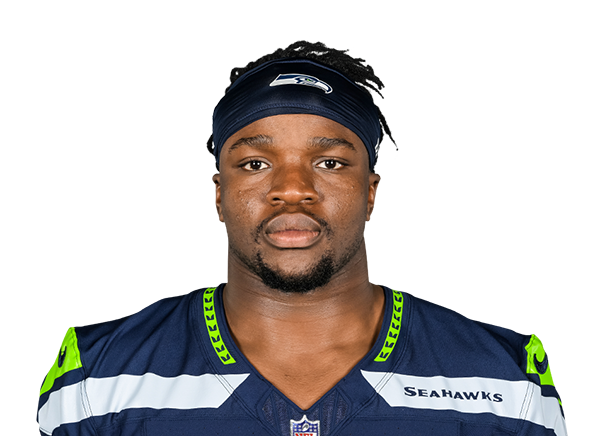 Boye MafeDE · CIN
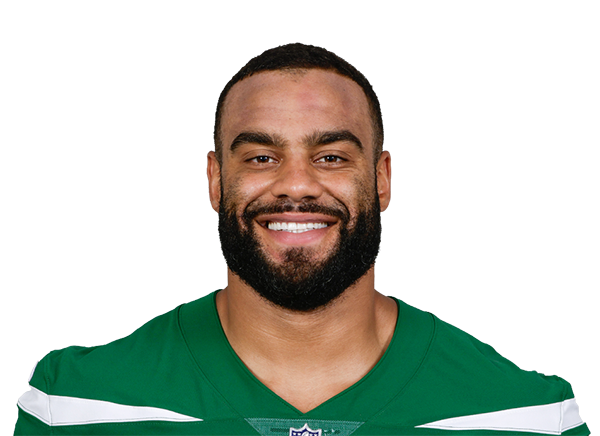 Solomon ThomasDT · TEN
 Cincinnati Bengals
Boye Mafe
Minnesota · 2022 draft, round 2, pick 40
 Tennessee Titans
Solomon Thomas
Stanford · 2017 draft, round 1, pick 3
Across the 7 shown metrics with numbers for at least two players (2026 season): Mafe leads in 6 and Thomas leads in 0; 1 is level. A count of who is ahead, not a verdict: the metrics overlap and do not weigh the same.
Usage
MafeThomasPercentile chips: vs 189 DL who played half the games, 2026 season
Defense
MafeThomasPercentile chips: vs 181 DL who played half the games, 2026 season
Advanced metrics2 more · tap to open
Usage
Defense
Advanced rows are not part of the “metrics led” count. Pick exactly what you want under “Choose”.
Matchups to start with
top passers · most targetedBox score totals from ESPN (regular season and playoffs; “last 4” is each player's four most recent games with a box score line). EPA, success rate, CPOE, aDOT, target and air-yard share from the nflverse play-by-play over the same games; snap share from nflverse snap counts. EPA per dropback includes sacks and scrambles. Carries are the official ESPN rush attempts; EPA per designed run leaves out quarterback scrambles (they count as dropbacks) and kneel-downs, so for a quarterback the two counts differ. Per opportunity divides counting stats by nflverse dropbacks (passing), ESPN targets (receiving) and ESPN carries (rushing); other counts go per game. Percentiles rank each value among players at the same position with enough volume in the same period (the same groups as the player cards: QBs 12 dropbacks a week, RBs 4.5 carries, wide receivers 2.5 targets, tight ends 2, defenders half the games; fewer than 8 peers, no percentile). The bars compare the players on the page only, not the league.