 Tampa Bay BuccaneersBucs vs. Lions Game Blog | Week 11 2026
 InjuryAaron Rodgers: Active → Cleared9 min ago
 New York GiantsLive: Highlights & updates from Giants vs. Jaguars
 ESPNWeek 11 NFL highlights: Best plays, moments, touchdowns, more
 Denver BroncosStatements from Commissioner Roger Goodell, football world on passing of Ring of Famer Tom Jackson
 Pro Football RumorsPats, Cardinals, Ravens Could Pursue Daniel Jones
 InjuryTony Adams: Active → Questionable2 h ago
 InjuryMike Jackson: Questionable → Active2 h ago
 InjuryDJ Wonnum: Active → Cleared2 h ago
 Kansas City ChiefsWeek 11 Inactive Players | Cardinals vs. Chiefs
 New Orleans SaintsNew Orleans Saints inactives for Chicago Bears game | 2026 NFL Week 11
 Buffalo BillsBuffalo Bills inactives vs. Dolphins | Week 11
Week 10 · 202649ers 46 · 40 Cowboys
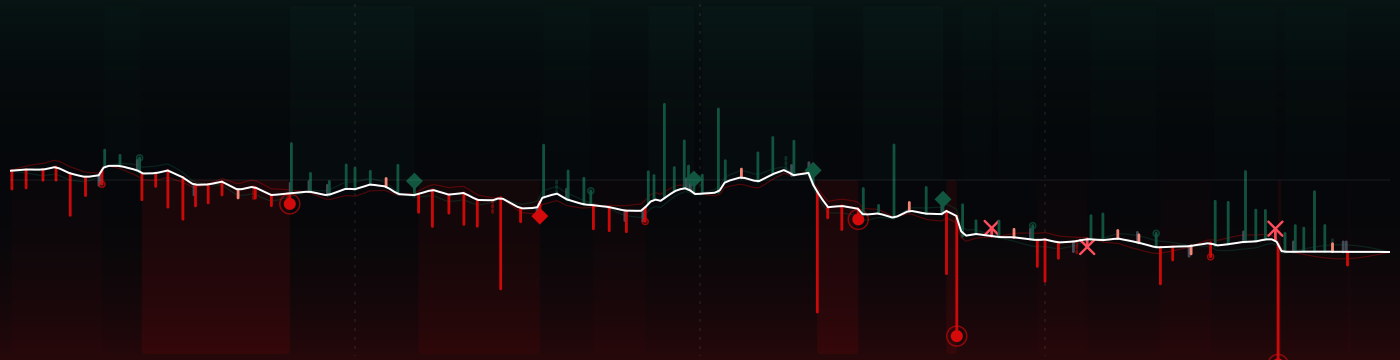
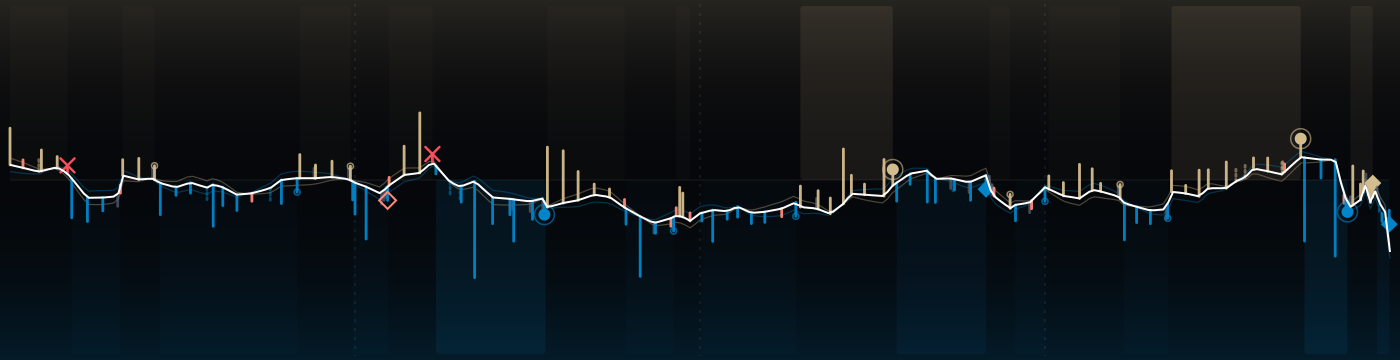
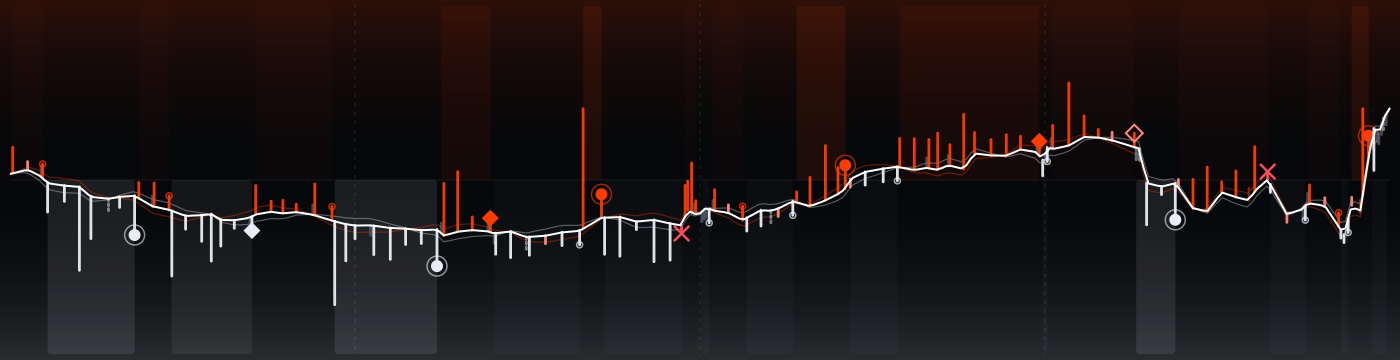
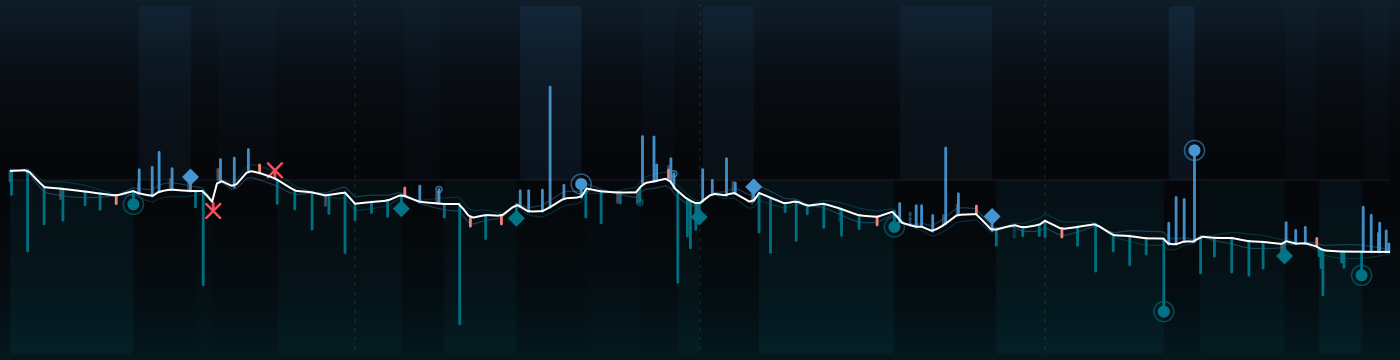
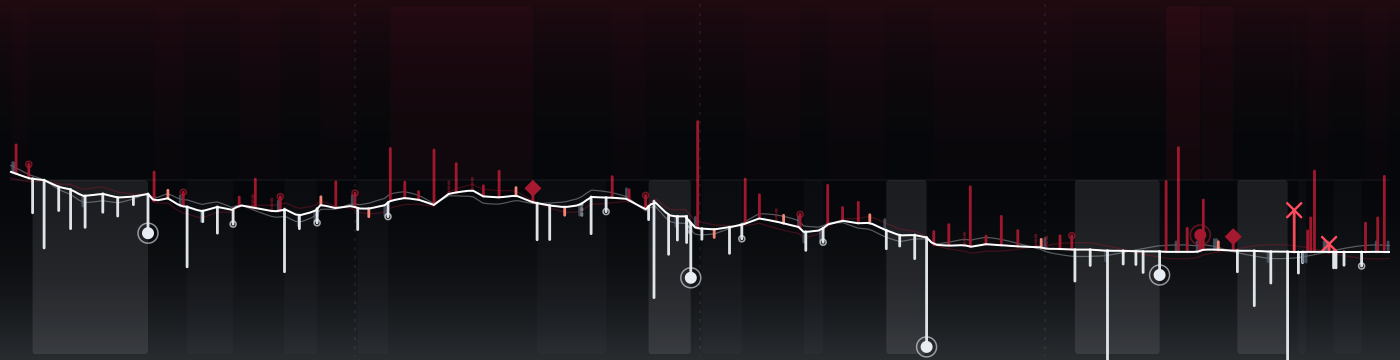
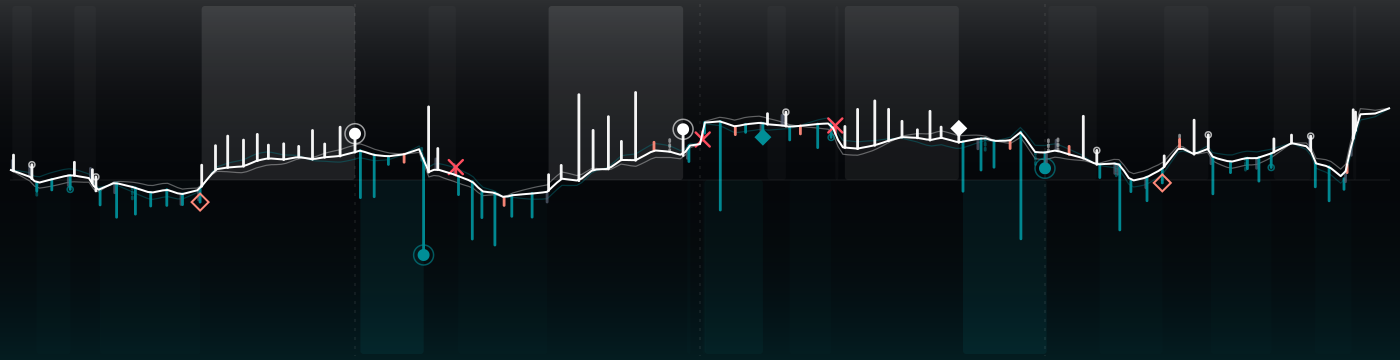
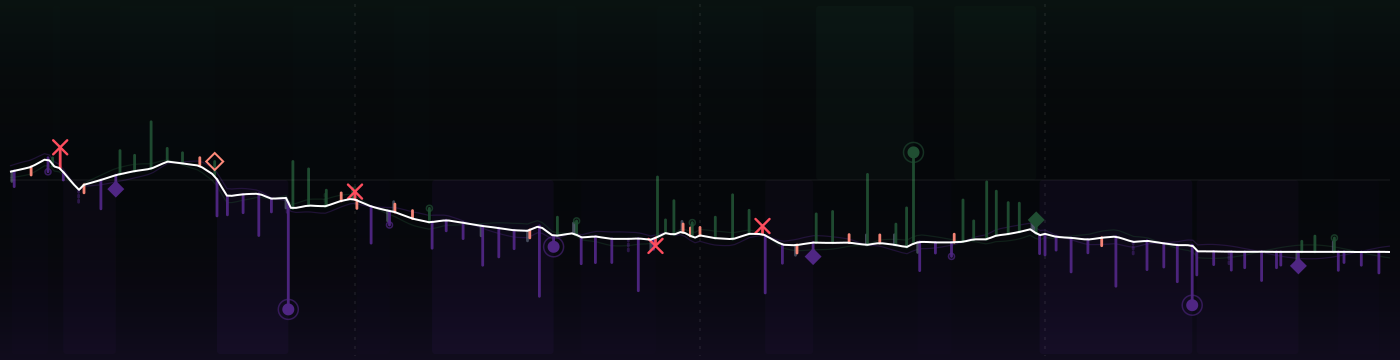
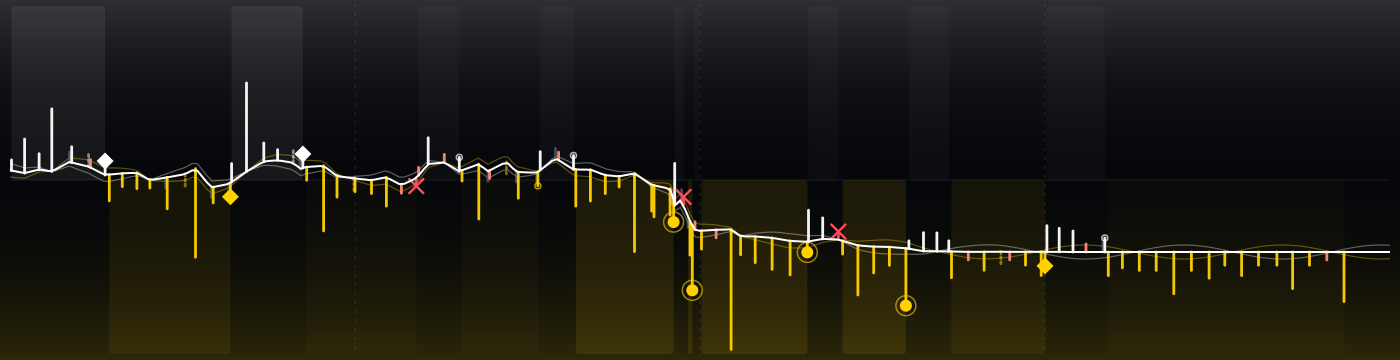
159 plays, one strand. 49ers won after 3 lead changes; 49ers peaked at 99% to win, Cowboys at 73%. The white spine is the win probability, every rung a snap: up for DAL, down for SF, as long as the yards it gained.
↳Bottom line3 lead changes; 49ers peaked at 99% to win, Cowboys at 73%.
?How to read this chart
- Read it left to right:
- kickoff on the left, final whistle on the right.
- The white line
- is the chance that Cowboys win, play by play. High = DAL in control, low = SF in control, the middle is a coin flip. Each crossing of the middle is a change in who was more likely to win.
- Each little bar is one play:
- up for DAL on offense, down for SF; the longer the bar, the more yards. The key under the picture explains the marks (touchdown, turnover, field goal, punt).
 Cowboys ↑
 49ers ↓
The strands compared
?How to read this chart
- Each row compares the two teams
- on one stat: SF on the left, DAL on the right. The longer bar is the bigger number.
- Explosive plays
- are long gains (big runs and passes). Peak win prob. is the highest chance to win each team reached at any moment.
Every possession
?How to read this chart
- Each tile is one possession,
- in game order, colored by the team that had the ball.
- Inside:
- the team, how it ended (TD = touchdown, FG = field goal, INT = interception, FUM = fumble, otherwise punt or downs) and the yards gained. Brighter tiles are drives that scored.
The plays that moved it most
↳Bottom lineThe biggest swing: play 1, 2.8 expected points for Cowboys.
?How to read this chart
- The strip is the game clock;
- each numbered dot is one of the plays below, placed when it happened and colored by the team on offense.
- EP (expected points)
- is how many points the play added to (+) or took away from (−) the offense's expected score. +3.5 EP is worth more than a field goal; big minus numbers are usually turnovers.
- 1Q1 1:15 · DAL · Touchdown+2.8 EP
77-B.Jones reported in as eligible. 4-D.Prescott pass deep right to 3-G.Pickens for 35 yards, TOUCHDOWN.
- 2Q2 12:02 · SF · Completion+2.4 EP
13-B.Purdy pass deep left to 3-K.Allen ran ob at DAL 38 for 23 yards.
- 3Q2 4:16 · DAL · Touchdown+4.1 EP
4-D.Prescott pass short left to 3-G.Pickens for 39 yards, TOUCHDOWN.
- 4Q2 2:43 · SF · Touchdown+5.7 EP
13-B.Purdy pass short right to 23-C.McCaffrey for 74 yards, TOUCHDOWN.
- 5Q3 12:18 · SF · Touchdown+2.3 EP
26-K.Black left end for 25 yards, TOUCHDOWN.
- 6Q3 7:13 · SF · Touchdown+4.7 EP
19-D.Samuel left end for 70 yards, TOUCHDOWN.
- 7Q4 3:47 · DAL · Touchdown+4.0 EP
4-D.Prescott pass short left to 19-R.Flournoy for 11 yards, TOUCHDOWN.
- 8Q4 3:32 · SF · Touchdown+5.0 EP
13-B.Purdy pass short right to 23-C.McCaffrey for 66 yards, TOUCHDOWN.
The one play that could have changed it
?How to read this chart
- The line is win probability
- over the game (top = home team ahead). The dot marks the one play that could have gone either way; the big % is the losing team's chance right after it.
- Press Flip it
- to see where that chance would have gone if the play had gone the other way. Only that instant is priced: the rest of the game never happened.
If the Cowboys had recovered that fumble
Q4 0:37 26-K.Black left end to DAL 47 for no gain (92-Q.Williams; 40-V.Miller). FUMBLES (92-Q.Williams), and recovers at DAL 46.
 24@21
 10@35

 24@27
 40@23

 22@24

 34@6

 21@13



 23@20