 ESPNFalcons adjust to major roster changes after trade deadline
 ESPN49ers not overlooking Cowboys amid NFC playoff push
 Philadelphia EaglesZach Ertz surprises Julie Ertz with National Soccer Hall of Fame selection
 Pro Football RumorsBills’ Late Push Convinced Titans To Trade S Amani Hooker Before Deadline
 ESPNDrew Lock set to start vs. Raiders
 Pro Football RumorsNFL Practice Squad Updates: 11/12/26
 InjuryMatthew Stafford: Active → Cleared5 h ago
 InjuryTucker Kraft: Active → Cleared6 h ago
 InjuryJustin Eboigbe: Questionable → Cleared7 h ago
Week 10 · 2026Commanders 24 · 21 Giants
146 plays, one strand. Commanders won after 6 lead changes; Commanders peaked at 94% to win, Giants at 93%. The white spine is the win probability, every rung a snap: up for NYG, down for WSH, as long as the yards it gained.
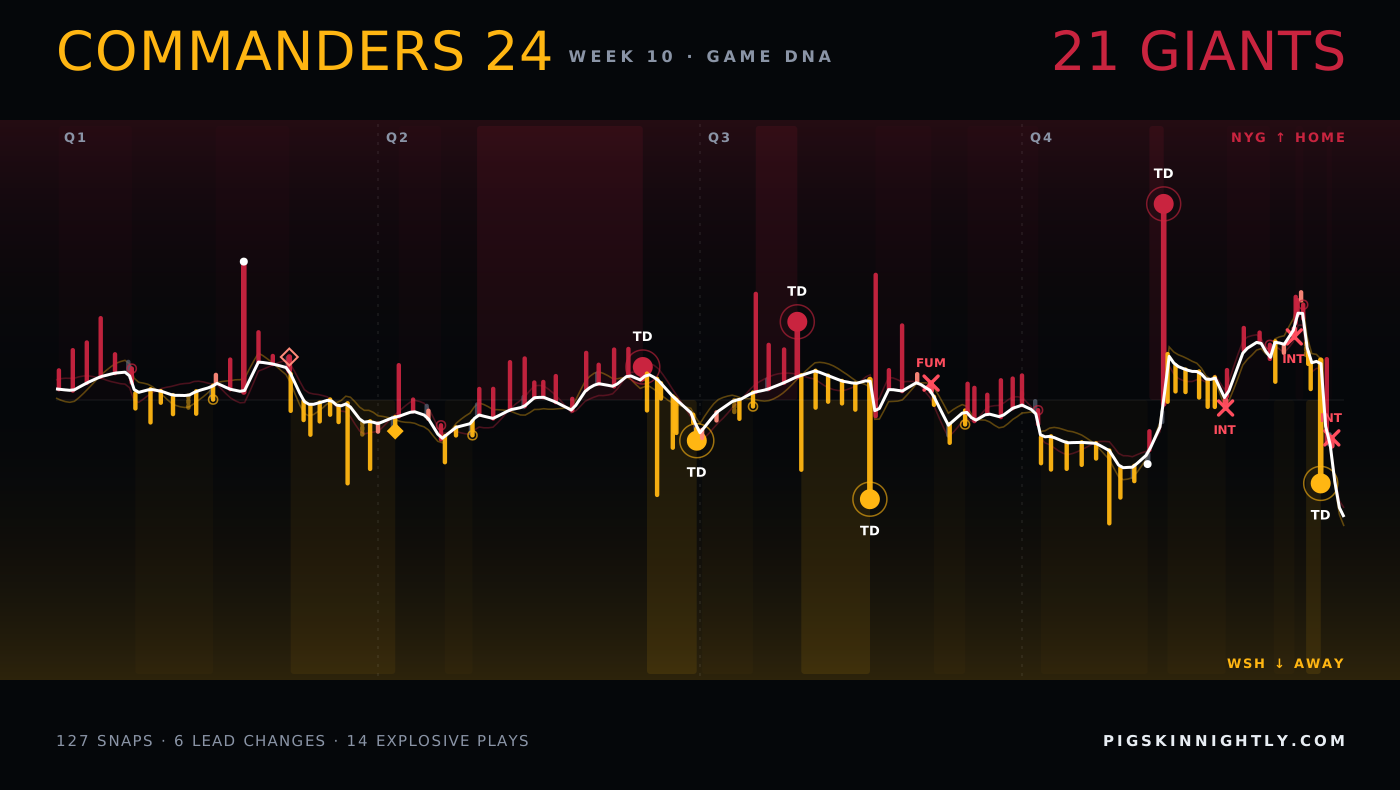
↳Bottom line6 lead changes; Commanders peaked at 94% to win, Giants at 93%.
?How to read this chart
- Read it left to right:
- kickoff on the left, final whistle on the right.
- The white line
- is the chance that Giants win, play by play. High = NYG in control, low = WSH in control, the middle is a coin flip. Each crossing of the middle is a change in who was more likely to win.
- Each little bar is one play:
- up for NYG on offense, down for WSH; the longer the bar, the more yards. The key under the picture explains the marks (touchdown, turnover, field goal, punt).
 Giants ↑
 Commanders ↓
The strands compared
?How to read this chart
- Each row compares the two teams
- on one stat: WSH on the left, NYG on the right. The longer bar is the bigger number.
- Explosive plays
- are long gains (big runs and passes). Peak win prob. is the highest chance to win each team reached at any moment.
Every possession
?How to read this chart
- Each tile is one possession,
- in game order, colored by the team that had the ball.
- Inside:
- the team, how it ended (TD = touchdown, FG = field goal, INT = interception, FUM = fumble, otherwise punt or downs) and the yards gained. Brighter tiles are drives that scored.
The plays that moved it most
↳Bottom lineThe biggest swing: play 1, 3.4 expected points for Giants.
?How to read this chart
- The strip is the game clock;
- each numbered dot is one of the plays below, placed when it happened and colored by the team on offense.
- EP (expected points)
- is how many points the play added to (+) or took away from (−) the offense's expected score. +3.5 EP is worth more than a field goal; big minus numbers are usually turnovers.
- 1Q1 6:15 · NYG · Completion+3.4 EP
18-J.McCarthy pass short left to 44-C.Skattebo pushed ob at WAS 21 for 34 yards (20-Q.Martin) [92-D.Armstrong].
- 2Q1 4:08 · NYG · Missed field goal−3.3 EP
34-D.Zvada 33 yard field goal is No Good, Wide Left, Center-58-B.Mann, Holder-15-J.Stout.
- 3Q3 7:05 · WSH · Touchdown+3.6 EP
5-J.Daniels pass short right to 14-A.Williams for 31 yards, TOUCHDOWN.
- 4Q3 4:14 · NYG · Fumble lost−4.5 EP
18-J.McCarthy pass short right to 1-M.Nabers to WAS 16 for 3 yards (4-F.Luvu). FUMBLES (4-F.Luvu), RECOVERED by WAS-39-J.Reaves at WAS 20.
- 5Q4 9:09 · WSH · Incomplete−3.2 EP
5-J.Daniels pass incomplete short middle to 3-S.Diggs (24-A.Washington).
- 6Q4 8:24 · NYG · Touchdown+6.5 EP
18-J.McCarthy pass deep middle to 9-I.Likely for 66 yards, TOUCHDOWN.
- 7Q4 5:31 · WSH · Interception−4.0 EP
5-J.Daniels pass deep left intended for 85-C.Okonkwo INTERCEPTED by 8-J.Holland at NYG 0. Touchback. The Replay Official reviewed the touchb
- 8Q4 1:05 · WSH · Touchdown+4.2 EP
5-J.Daniels pass short middle to 3-S.Diggs for 32 yards, TOUCHDOWN.
The one play that could have changed it
?How to read this chart
- The line is win probability
- over the game (top = home team ahead). The dot marks the one play that could have gone either way; the big % is the losing team's chance right after it.
- Press Flip it
- to see where that chance would have gone if the play had gone the other way. Only that instant is priced: the rest of the game never happened.
If that interception had fallen incomplete
Q4 0:34 18-J.McCarthy pass deep right intended for 1-M.Nabers INTERCEPTED by 29-R.Douglas at WAS 11. 29-R.Douglas to WAS 11 for no gain (1-M.Nabers).