 InjuryDeshaun Watson: Questionable → Activejust now
 Baltimore RavensLate for Work: Pundits Grade Trade for Offensive Lineman Ryan Neuzil
 Green Bay PackersInbox: He would've been a much bigger story
 InjuryPuka Nacua: Doubtful → Questionable18 min ago
 New Orleans SaintsFive things to know about the New Orleans Saints for Wednesday, November 11
 Indianapolis ColtsIndiana Football Digest Insider 2026 - Sectional Finals recap
 New York JetsWays to Watch and Stream | Jets vs. Bills
 ESPNJacksonville Jaguars' Foyesade Oluokun leads the way again in Africa's Week 9 NFL exploits
 Detroit LionsNFC NORTH: Where all four teams stand heading into Week 10
 ESPNQuestions on 2026 NFL trade deadline deals: Does Kirk Cousins lift the Vikings?
 ESPNCowboys rave about Quinnen Williams a year after trade deadline deal
 ESPNBig plays by Broncos defense in late-game situations keying Denver's 7-2 start
 InjuryEric Wilson: Active → Cleared11 h ago
 InjuryJordyn Brooks: Active → Cleared13 h ago
 InjuryChristian Barmore: Active → Cleared13 h ago
Compare players
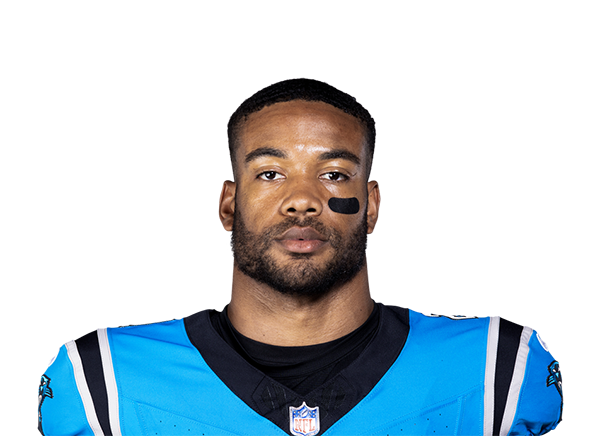 Jeremy ChinnS · LV
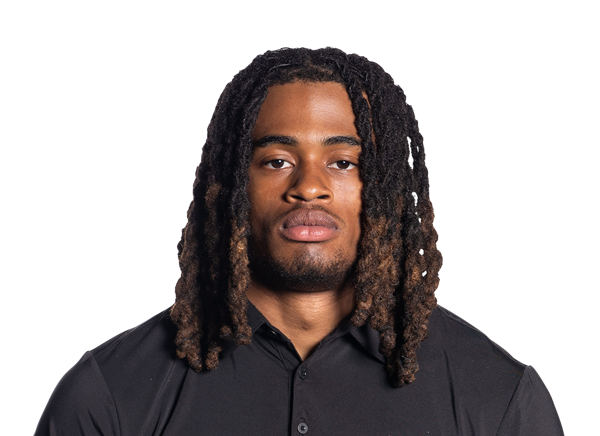 Will Lee IIICB · CAR
 Las Vegas Raiders
Jeremy Chinn
Southern Illinois · 2020 draft, round 2, pick 64
 Carolina Panthers
Will Lee III
Texas A&M · 2026 draft, round 4, pick 129
Questionable · Hamstring
Across the 7 shown metrics with numbers for at least two players (2026 season): Chinn leads in 6 and Lee III leads in 1. A count of who is ahead, not a verdict: the metrics overlap and do not weigh the same.
Usage
ChinnLee IIIPercentile chips: vs 112 safeties who played half the games, 2026 season
Defense
ChinnLee IIIPercentile chips: vs 107 safeties who played half the games, 2026 season
Advanced metrics2 more · tap to open
Usage
Defense
Advanced rows are not part of the “metrics led” count. Pick exactly what you want under “Choose”.
Matchups to start with
top passers · most targetedBox score totals from ESPN (regular season and playoffs; “last 4” is each player's four most recent games with a box score line). EPA, success rate, CPOE, aDOT, target and air-yard share from the nflverse play-by-play over the same games; snap share from nflverse snap counts. EPA per dropback includes sacks and scrambles. Carries are the official ESPN rush attempts; EPA per designed run leaves out quarterback scrambles (they count as dropbacks) and kneel-downs, so for a quarterback the two counts differ. Per opportunity divides counting stats by nflverse dropbacks (passing), ESPN targets (receiving) and ESPN carries (rushing); other counts go per game. Percentiles rank each value among players at the same position with enough volume in the same period (the same groups as the player cards: QBs 12 dropbacks a week, RBs 4.5 carries, wide receivers 2.5 targets, tight ends 2, defenders half the games; fewer than 8 peers, no percentile). The bars compare the players on the page only, not the league.