 InjuryMichael Taaffe: Active → Cleared23 min ago
 InjuryJordan Love: Active → Cleared23 min ago
 InjuryChristian McCaffrey: Active → Cleared55 min ago
 InjuryGreg Newsome II: Active → Cleared1 h ago
 InjuryA.J. Haulcy: Out → Questionable1 h ago
 InjuryMarcus Epps: Active → Cleared1 h ago
 Pro Football RumorsNFL Practice Squad Updates: 11/11/26
 Las Vegas RaidersGutierrez: Raiders long-term plan comes to fruition with insertion of Fernando Mendoza at quarterback
 Los Angeles RamsFrom the Podium: Sean McVay and Matthew Stafford preview Rams' second meeting with Cardinals
 ESPNSaints get Travis Etienne back at practice
 Arizona CardinalsFor Starters, Carson Beck Ready To Play First Game Against Rams
 Seattle SeahawksWeek 10 Injury Report: Seahawks at Raiders
 Jacksonville JaguarsWednesday Insider: Davis, Godchaux Ready To Stop the Run
Compare players
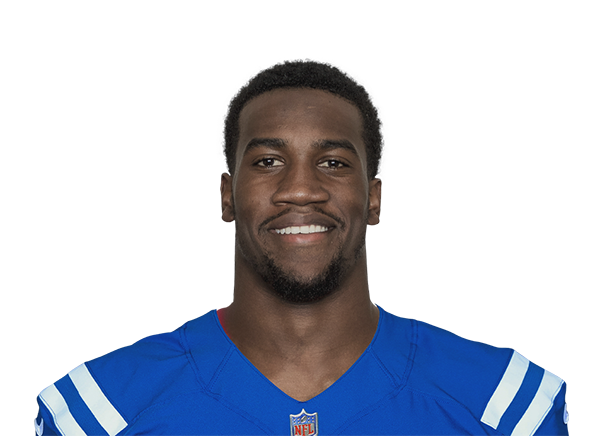 Jacob MartinDE · TEN
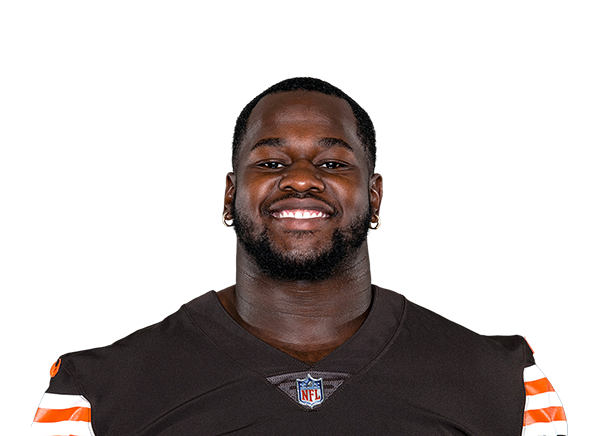 Sam KamaraDT · CLE
 Tennessee Titans
Jacob Martin
Temple · 2018 draft, round 6, pick 186
 Cleveland Browns
Across the 7 shown metrics with numbers for at least two players (last 4 games): Martin leads in 5 and Kamara leads in 1; 1 is level. A count of who is ahead, not a verdict: the metrics overlap and do not weigh the same.
Usage
MartinKamaraPercentile chips: vs 245 DL who played half the games, last 4 games
Defense
MartinKamaraPercentile chips: vs 238 DL who played half the games, last 4 games
Advanced metrics2 more · tap to open
Usage
Defense
Advanced rows are not part of the “metrics led” count. Pick exactly what you want under “Choose”.
Matchups to start with
top passers · most targetedBox score totals from ESPN (regular season and playoffs; “last 4” is each player's four most recent games with a box score line). EPA, success rate, CPOE, aDOT, target and air-yard share from the nflverse play-by-play over the same games; snap share from nflverse snap counts. EPA per dropback includes sacks and scrambles. Carries are the official ESPN rush attempts; EPA per designed run leaves out quarterback scrambles (they count as dropbacks) and kneel-downs, so for a quarterback the two counts differ. Per opportunity divides counting stats by nflverse dropbacks (passing), ESPN targets (receiving) and ESPN carries (rushing); other counts go per game. Percentiles rank each value among players at the same position with enough volume in the same period (the same groups as the player cards: QBs 12 dropbacks a week, RBs 4.5 carries, wide receivers 2.5 targets, tight ends 2, defenders half the games; fewer than 8 peers, no percentile). The bars compare the players on the page only, not the league.