 InjuryCharlie Jones: Questionable → Active9 min ago
 InjuryCarl Granderson: Active → Cleared9 min ago
 Las Vegas RaidersFernando Mendoza named Raiders' starting quarterback
 Cleveland BrownsBrowns announce unofficial depth chart for Week 10 vs. the Texans
 Pro Football RumorsVikings Had Interest In Justin Herbert, Daniel Jones, Geno Smith
 Los Angeles RamsFirst Look: Rams take on Cardinals in Arizona in Week 10 riding three-game win streak
 ESPNCommanders stand pat at trade deadline
 Seattle SeahawksHow To Watch, Listen And Follow Seahawks at Raiders In Week 10 On Sunday, November 15
 ESPNFalcons trade center Ryan Neuzil to Ravens for guard Andrew Vorhees, pick
 Vikings DeskVikings lose by 17 and the snaps say it should have been worse54 min ago
 ESPNNFL trade deadline grades: Deals for Kirk Cousins, Josh Downs, Daiyan Henley
 San Francisco 49ers49ers Place DL Gracen Halton on Injured Reserve
Compare players
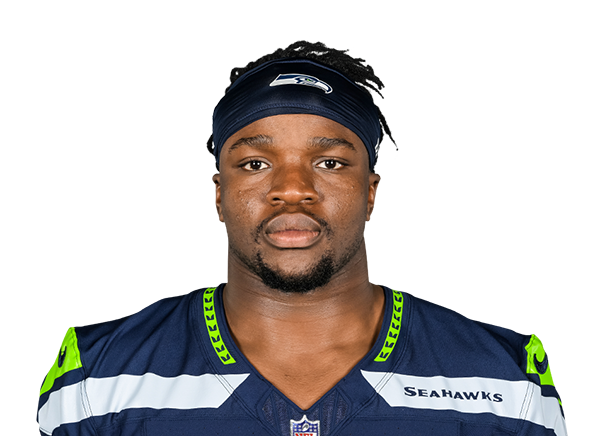 Boye MafeDE · CIN
 Uar BernardDT · PHI
 Cincinnati Bengals
Boye Mafe
Minnesota · 2022 draft, round 2, pick 40
 Philadelphia Eagles
Uar Bernard
2026 draft, round 7, pick 251
Not enough numbers in this view to set Mafe and Bernard against each other.
Usage
MafeBernardPercentile chips: vs 189 DL who played half the games, 2026 season
Defense
MafeBernardPercentile chips: vs 181 DL who played half the games, 2026 season
Advanced metrics2 more · tap to open
Usage
Defense
Advanced rows are not part of the “metrics led” count. Pick exactly what you want under “Choose”.
Matchups to start with
top passers · most targetedBox score totals from ESPN (regular season and playoffs; “last 4” is each player's four most recent games with a box score line). EPA, success rate, CPOE, aDOT, target and air-yard share from the nflverse play-by-play over the same games; snap share from nflverse snap counts. EPA per dropback includes sacks and scrambles. Carries are the official ESPN rush attempts; EPA per designed run leaves out quarterback scrambles (they count as dropbacks) and kneel-downs, so for a quarterback the two counts differ. Per opportunity divides counting stats by nflverse dropbacks (passing), ESPN targets (receiving) and ESPN carries (rushing); other counts go per game. Percentiles rank each value among players at the same position with enough volume in the same period (the same groups as the player cards: QBs 12 dropbacks a week, RBs 4.5 carries, wide receivers 2.5 targets, tight ends 2, defenders half the games; fewer than 8 peers, no percentile). The bars compare the players on the page only, not the league.