 ESPNNFL Week 11 arrivals: CeeDee Lamb leads the way ahead of Titans-Cowboys
 InjuryTommy Tremble: Questionable → Active35 min ago
 InjuryTony Adams: Active → Questionable35 min ago
 InjuryDJ Wonnum: Active → Cleared35 min ago
 InjuryYaya Diaby: Questionable → Active35 min ago
 InjuryDerrick Harmon: Active → Cleared35 min ago
 Pro Football RumorsFormer Broncos LB, ESPN Broadcaster Tom Jackson Passes Away
 Kansas City ChiefsWeek 11 Inactive Players | Cardinals vs. Chiefs
 New Orleans SaintsNew Orleans Saints inactives for Chicago Bears game | 2026 NFL Week 11
 Buffalo BillsBuffalo Bills inactives vs. Dolphins | Week 11
 Baltimore RavensRookie Running Back Adam Randall Inactive vs. Panthers
 Philadelphia EaglesSteelers vs. Eagles Inactives
 Pro Football RumorsBrandon Aiyuk’s 49ers Tenure Nearing An End? Latest On WR’s Potential Suitors


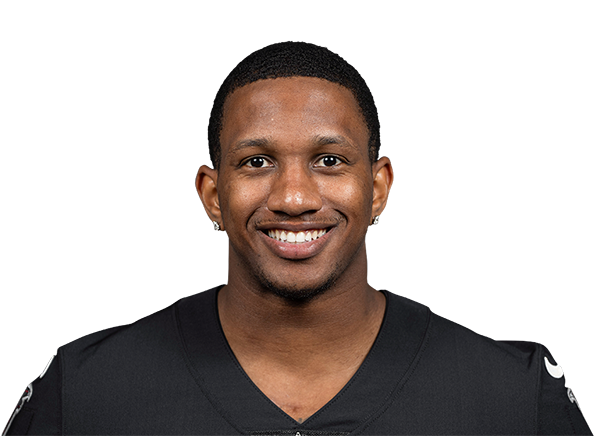
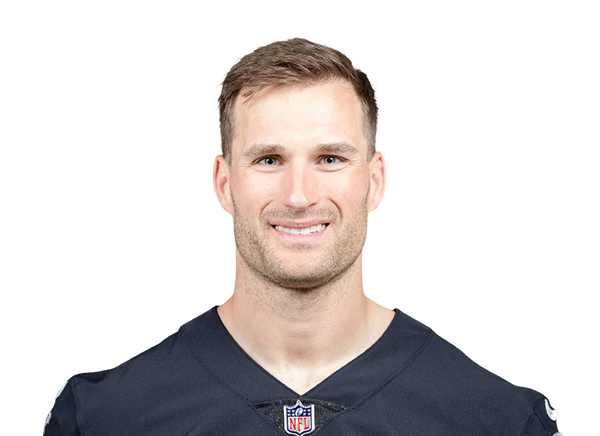
- -0.036EPA/db+0.105
- -5.6CPOE+0.2
- 7.1Y/A7.4
- 4.1%TD %6.4%
- 2.9%INT %2.6%
- 4.5%Sack %3.8%
Depth chart rank 1, adjusted for the injury report.
Head to head
Grades = average percentile vs the position · season to date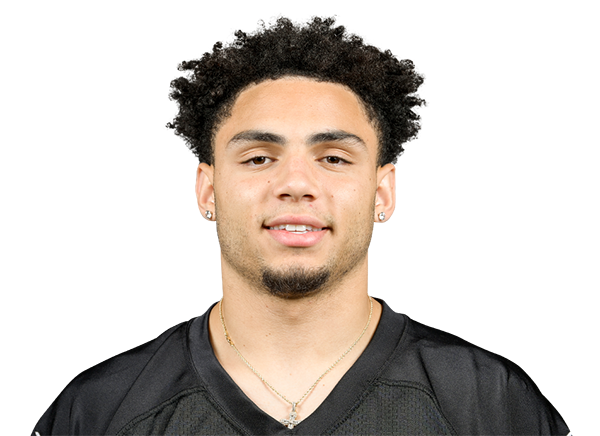
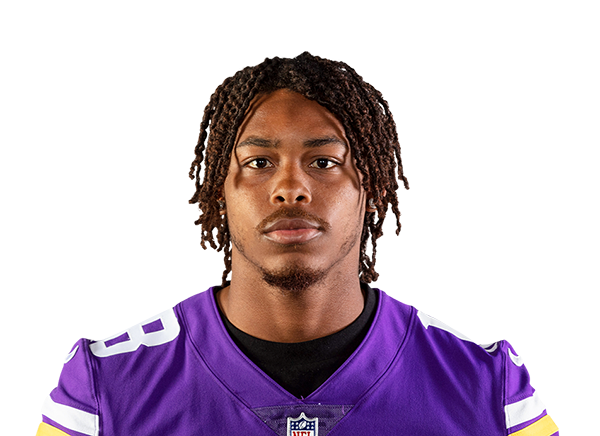
- 8.0 tgt/gTgt/g8.1 tgt/g
- 80.1 yds/gYds/g58.4 yds/g
- 10.0Yds/tgt7.3
- 63%Catch %63%
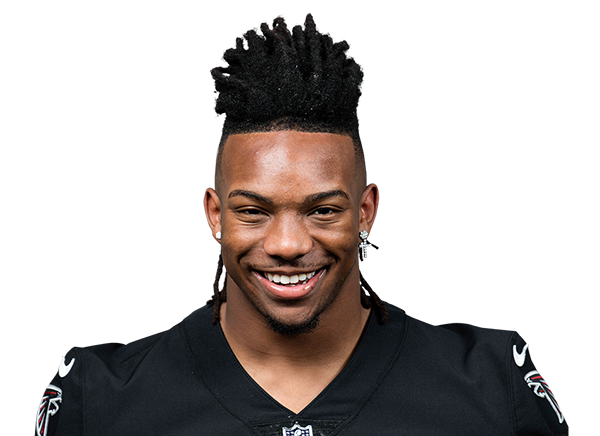
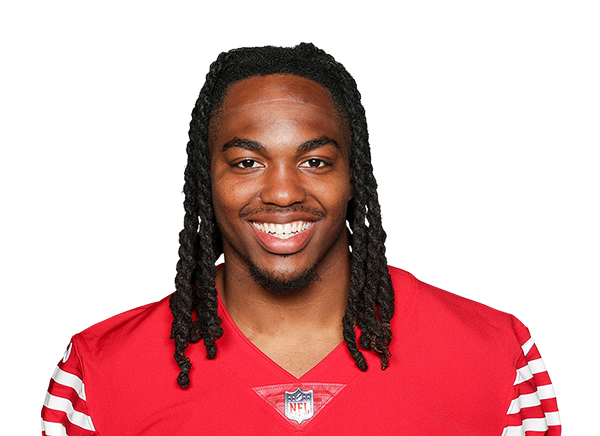
- 95.1 yds/gRush/g48.2 yds/g
- 5.1YPC4.0
- -0.013EPA/car-0.160
- 43%Success28%
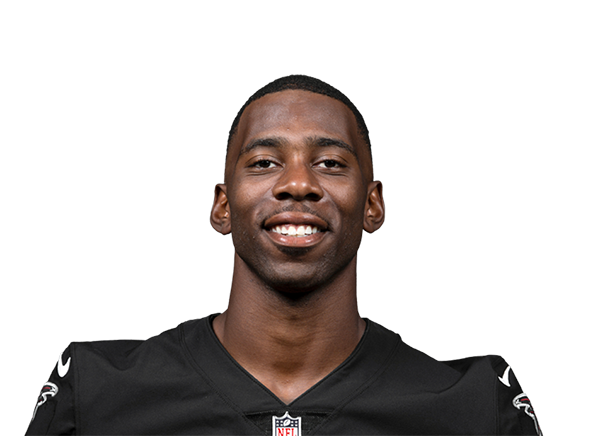
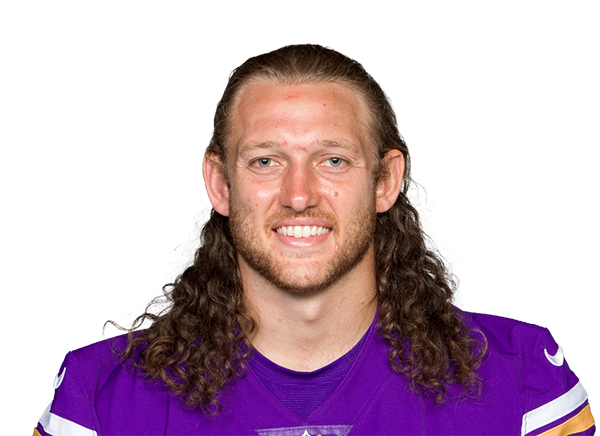
- 4.2 tgt/gTgt/g5.5 tgt/g
- 27.0 yds/gYds/g41.0 yds/g
- 6.4Yds/tgt7.5
- 69%Catch %80%
- 3.8 tgt/gTgt/g1.7 tgt/g
- 41.6 yds/gYds/g9.0 yds/g
- 10.7Yds/tgt5.4
- 49%Catch %67%
The 22 on each side
Offense · defense · specialistsDepth chart rank 1, adjusted for the injury report. Kickoff Sun, Nov 29, 1 PM ET.
 AwayFalcons1 next man up
Offense
Defense
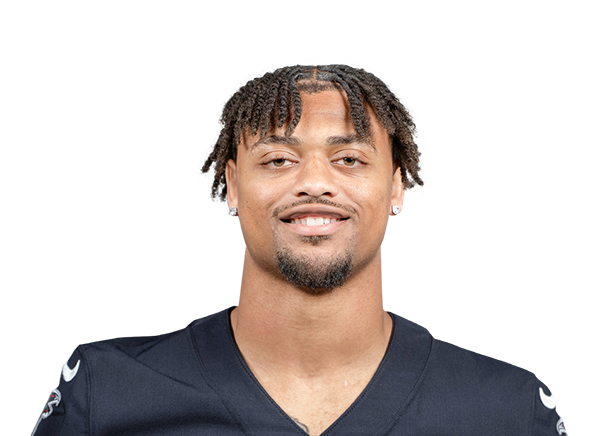
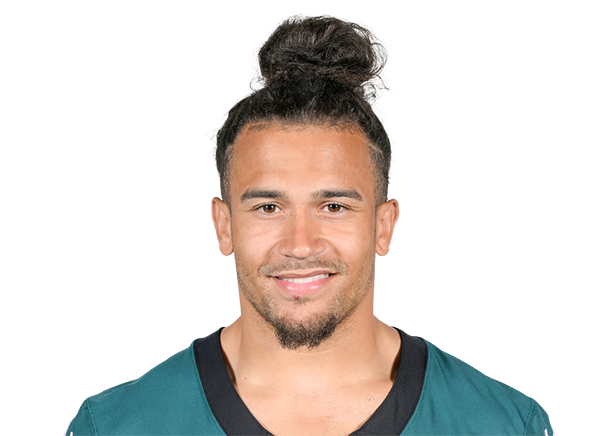
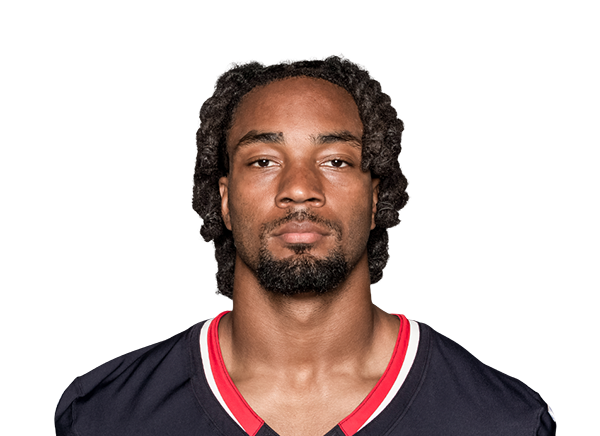
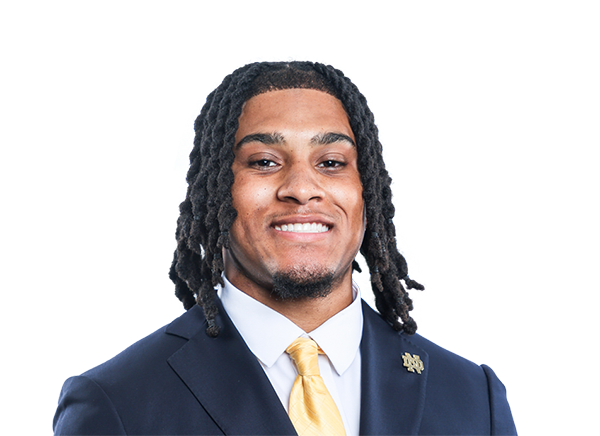
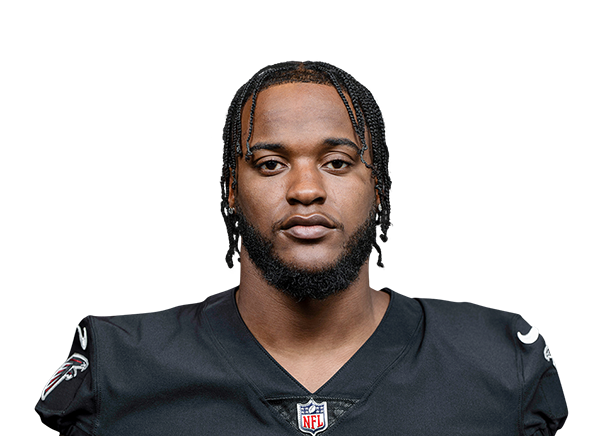
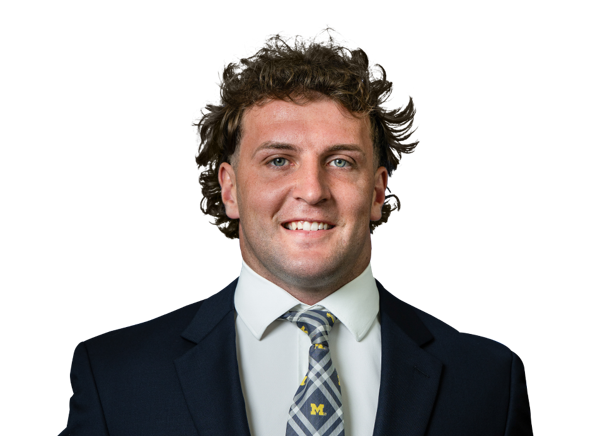
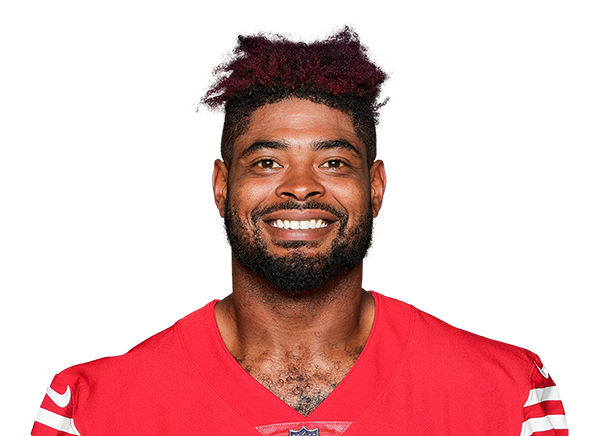
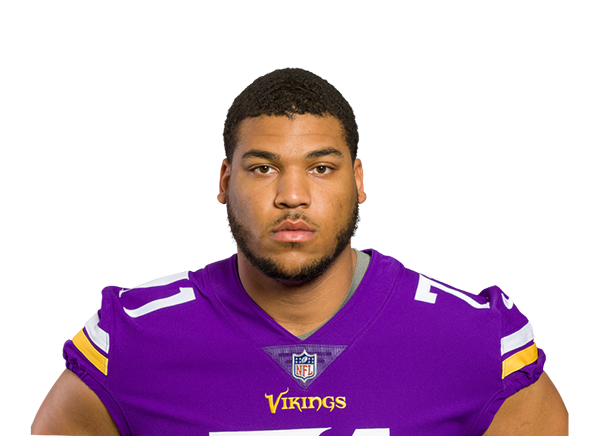

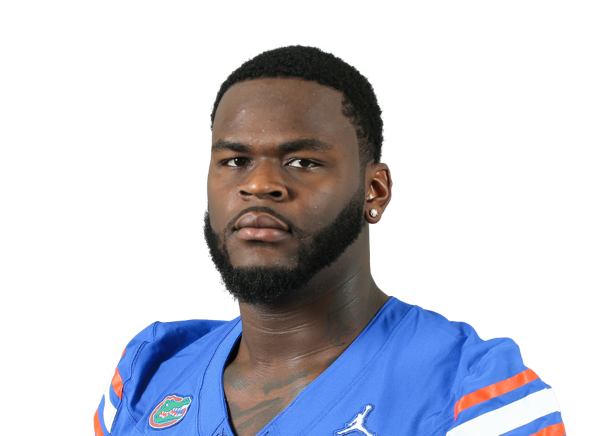
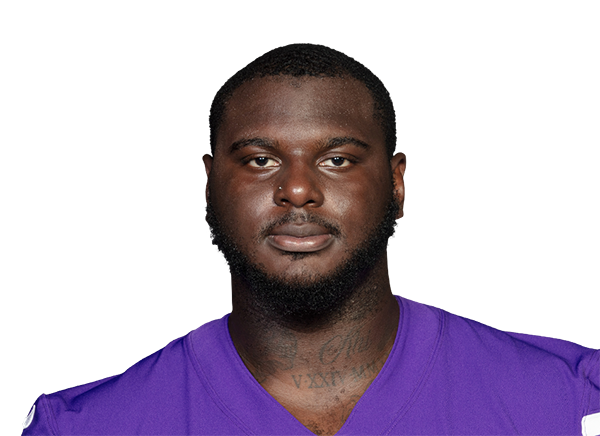
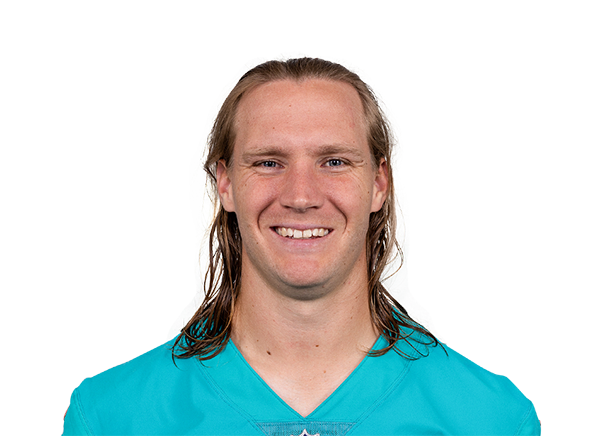
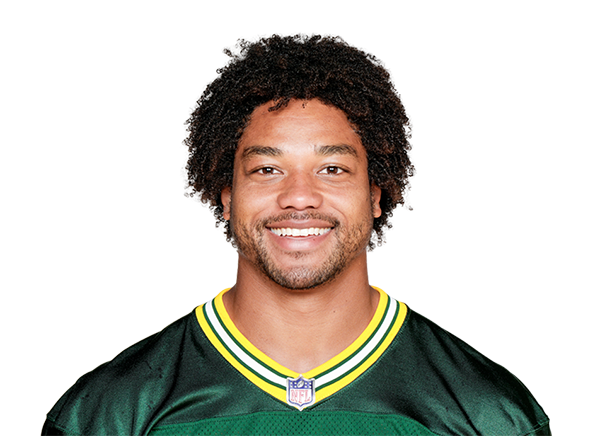
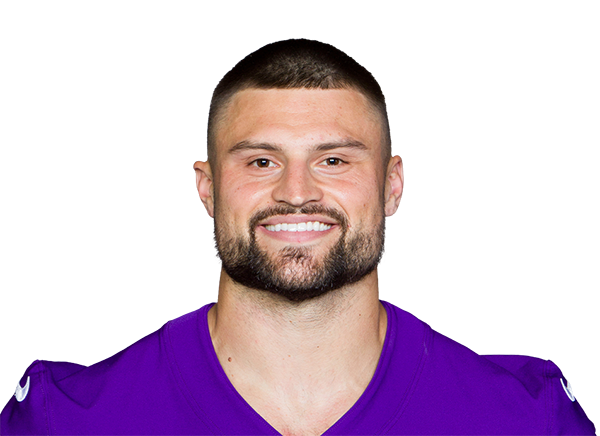
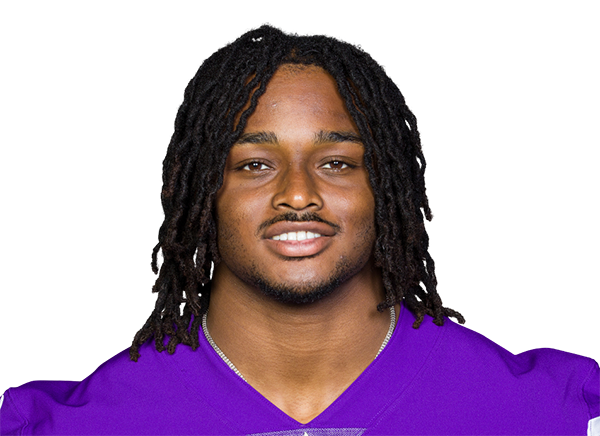
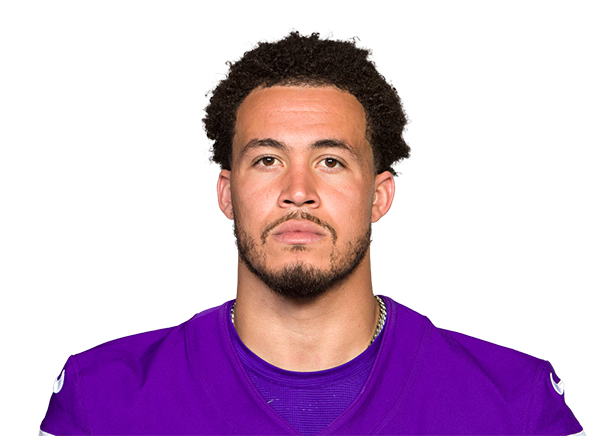
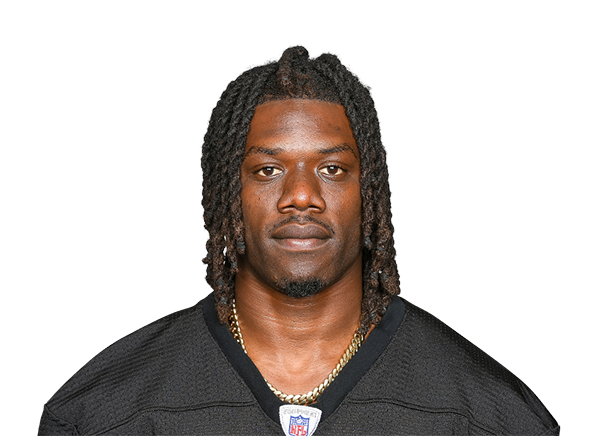
On the report
League injury report →Falcons2 listed
 Vikings4 listed
 Jordan AddisonWR · ThumbOut
 Kyler MurrayQB · HamstringOut
 Isaiah RodgersCB · QuadricepsQuestionable
 Jay WardS · KneeQuestionable