 Pro Football RumorsCardinals Work Out QBs Cooper Rush, Trevor Siemian
 ESPNWhy Giants' trade attempts 'just didn't happen'
 ESPNChiefs add WR Josh Downs at NFL trade deadline
 ESPNHow the Amani Hooker trade helps the Titans rebuild
 InjuryEric Wilson: Active → Cleared2 h ago
 Pro Football RumorsJets Work Out QBs Bailey Zappe, Austin Reed
 InjuryZach Allen: Active → Cleared3 h ago
 InjuryNathan Shepherd: Active → Cleared4 h ago
 Cincinnati BengalsInside The Drive | How Ja'Marr Chase Took Over Madrid
 ESPNRaiders name Fernando Mendoza starting QB after trading Kirk Cousins
 InjuryQuentin Lake: Active → Cleared5 h ago
 InjuryDre'Mont Jones: Active → Cleared5 h ago
 San Francisco 49ersPower Rankings: Where the 49ers Stand Entering Week 10
 ESPNGet ready for Chargers vs. Ravens on Monday Night Football
 Pro Football RumorsMinor NFL Transactions: 11/10/26
Compare players
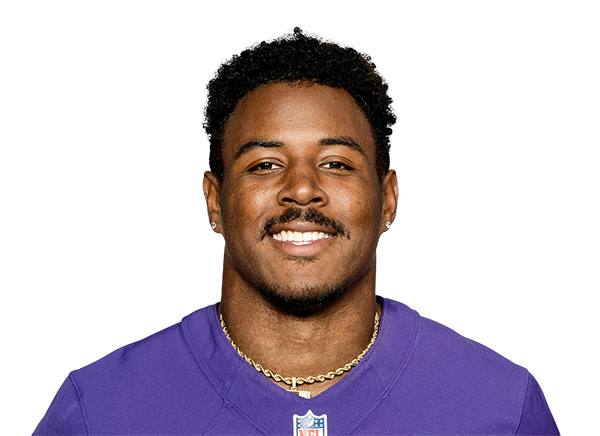 Owen WrightRB · LV
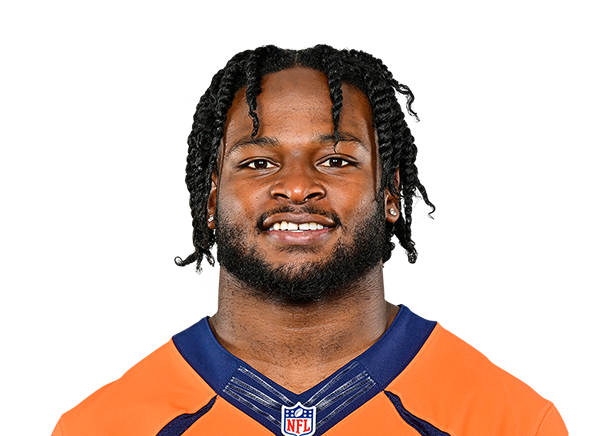 Javonte WilliamsRB · DAL
 Dallas Cowboys
Javonte Williams
North Carolina · 2021 draft, round 2, pick 35
Not enough numbers in this view to set Wright and Williams against each other.
Usage
WrightWilliamsPercentile chips: vs 92 RBs who played half the games, 2026 season
Rushing
WrightWilliamsPercentile chips: vs 54 RBs who have 4.5+ carries a week, 2026 season
Receiving
WrightWilliamsPercentile chips: vs 20 RBs who have 2.5+ targets a week (tight ends 2+), 2026 season
Advanced metrics14 more · tap to open
Usage
Rushing
Receiving
Advanced rows are not part of the “metrics led” count. Pick exactly what you want under “Choose”.
Expected points added across every role (passing, rushing, receiving) in the nflverse play-by-play model, in the period you picked. Lines run the total; a missing bar is a week without plays. The dot marks the best week among the 2 players.
Matchups to start with
top passers · most targetedBox score totals from ESPN (regular season and playoffs; “last 4” is each player's four most recent games with a box score line). EPA, success rate, CPOE, aDOT, target and air-yard share from the nflverse play-by-play over the same games; snap share from nflverse snap counts. EPA per dropback includes sacks and scrambles. Carries are the official ESPN rush attempts; EPA per designed run leaves out quarterback scrambles (they count as dropbacks) and kneel-downs, so for a quarterback the two counts differ. Per opportunity divides counting stats by nflverse dropbacks (passing), ESPN targets (receiving) and ESPN carries (rushing); other counts go per game. Percentiles rank each value among players at the same position with enough volume in the same period (the same groups as the player cards: QBs 12 dropbacks a week, RBs 4.5 carries, wide receivers 2.5 targets, tight ends 2, defenders half the games; fewer than 8 peers, no percentile). The bars compare the players on the page only, not the league.