 InjuryA.J. Brown: Out → Questionablejust now
 ESPNBroncos say trade with Chargers for LB Henley 'will not be finalized'
 ESPNRams optimistic about Davante Adams' return after quiet trade deadline
 InjuryChristian Darrisaw: Active → Cleared6 h ago
 InjuryDaniel Jones: Active → Cleared6 h ago
 ESPN49ers face questions at corner heading into Week 10
 InjuryChamarri Conner: Active → Cleared7 h ago
 InjuryTrey McBride: Active → Cleared7 h ago
 InjuryChris Olave: Active → Cleared7 h ago
 Cincinnati BengalsQuick Hits | Joe Burrow Eyes Drew Brees' Record Of 74.4%: 'That Would Be A Fun One To Break'
 ESPNTitans explain decision to keep Tony Pollard
 Las Vegas RaidersGutierrez: Raiders long-term plan comes to fruition with insertion of Fernando Mendoza at quarterback
Compare players
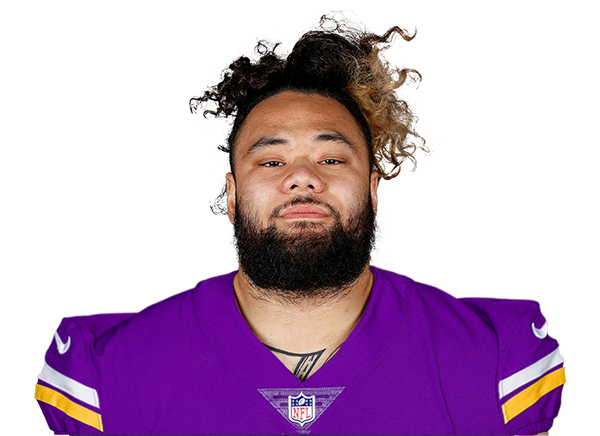 Khyiris TongaDT · KC
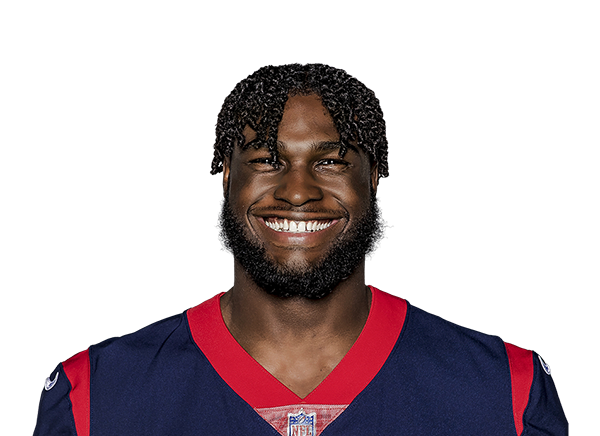 Will Anderson Jr.DE · HOU
 Chase YoungDE · NO
 HOU
Across the 7 shown metrics with numbers for at least two players (2026 season): Anderson Jr. leads in 5, Young leads in 1 and Tonga leads in 0; 1 is level. A count of who is ahead, not a verdict: the metrics overlap and do not weigh the same.
Usage
Percentile chips: vs 189 DL who played half the games, 2026 season
Defense
Percentile chips: vs 181 DL who played half the games, 2026 season
Advanced metrics4 more · tap to open
Usage
Defense
Expected points added across every role (passing, rushing, receiving) in the nflverse play-by-play model, in the period you picked. Lines run the total; a missing bar is a week without plays. The dot marks the best week among the 3 players.
Matchups to start with
top passers · most targetedBox score totals from ESPN (regular season and playoffs; “last 4” is each player's four most recent games with a box score line). EPA, success rate, CPOE, aDOT, target and air-yard share from the nflverse play-by-play over the same games; snap share from nflverse snap counts. EPA per dropback includes sacks and scrambles. Carries are the official ESPN rush attempts; EPA per designed run leaves out quarterback scrambles (they count as dropbacks) and kneel-downs, so for a quarterback the two counts differ. Per opportunity divides counting stats by nflverse dropbacks (passing), ESPN targets (receiving) and ESPN carries (rushing); other counts go per game. Percentiles rank each value among players at the same position with enough volume in the same period (the same groups as the player cards: QBs 12 dropbacks a week, RBs 4.5 carries, wide receivers 2.5 targets, tight ends 2, defenders half the games; fewer than 8 peers, no percentile). The bars compare the players on the page only, not the league.