 Pittsburgh SteelersAsked and Answered: Nov. 12
 ESPNHow Kobe, LeBron, Steph and Brady are helping Jayden Daniels chase greatness
 ESPNInside the physical and mental toll of Malik Nabers' knee injury
 New England PatriotsPatriots Gameplan: who is getting on the plane to Munich for Sunday's Week 10 matchup vs. the Lions?
 ESPNBroncos say trade with Chargers for LB Henley 'will not be finalized'
 Pro Football RumorsBroncos-Bolts’ Daiyan Henley Trade Nixed
 ESPNRams optimistic about Davante Adams' return after quiet trade deadline
 InjuryDaniel Jones: Active → Cleared7 h ago
 ESPN49ers face questions at corner heading into Week 10
 InjuryChamarri Conner: Active → Cleared8 h ago
 InjuryTrey McBride: Active → Cleared8 h ago
 Cincinnati BengalsQuick Hits | Joe Burrow Eyes Drew Brees' Record Of 74.4%: 'That Would Be A Fun One To Break'
 ESPNTitans explain decision to keep Tony Pollard
Compare players
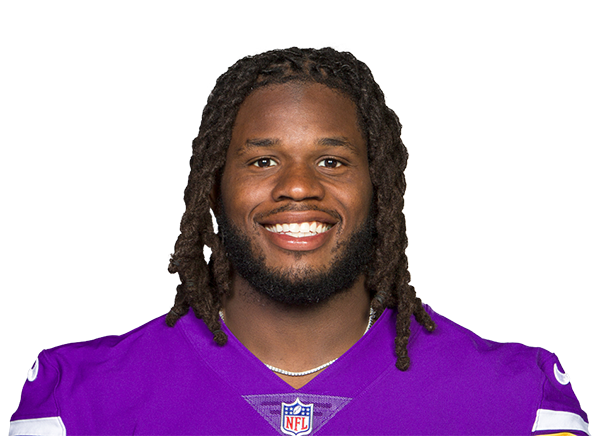 Joshua MetellusS · MIN
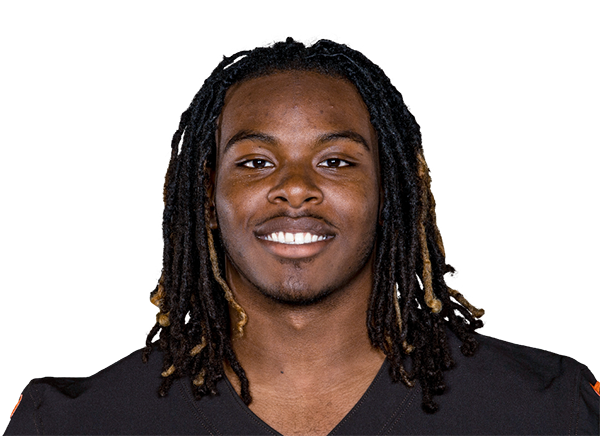 Martin Emerson Jr.CB · NO
 Minnesota Vikings
Joshua Metellus
Michigan · 2020 draft, round 6, pick 205
 New Orleans Saints
Martin Emerson Jr.
Mississippi State · 2022 draft, round 3, pick 68
Questionable · Shin
Across the 7 shown metrics with numbers for at least two players (last 4 games): Metellus leads in 3 and Emerson Jr. leads in 3; 1 is level. A count of who is ahead, not a verdict: the metrics overlap and do not weigh the same.
Usage
MetellusEmerson Jr.Percentile chips: vs 138 safeties who played half the games, last 4 games
Defense
MetellusEmerson Jr.Percentile chips: vs 143 safeties who played half the games, last 4 games
Advanced metrics2 more · tap to open
Usage
Defense
Advanced rows are not part of the “metrics led” count. Pick exactly what you want under “Choose”.
Matchups to start with
top passers · most targetedBox score totals from ESPN (regular season and playoffs; “last 4” is each player's four most recent games with a box score line). EPA, success rate, CPOE, aDOT, target and air-yard share from the nflverse play-by-play over the same games; snap share from nflverse snap counts. EPA per dropback includes sacks and scrambles. Carries are the official ESPN rush attempts; EPA per designed run leaves out quarterback scrambles (they count as dropbacks) and kneel-downs, so for a quarterback the two counts differ. Per opportunity divides counting stats by nflverse dropbacks (passing), ESPN targets (receiving) and ESPN carries (rushing); other counts go per game. Percentiles rank each value among players at the same position with enough volume in the same period (the same groups as the player cards: QBs 12 dropbacks a week, RBs 4.5 carries, wide receivers 2.5 targets, tight ends 2, defenders half the games; fewer than 8 peers, no percentile). The bars compare the players on the page only, not the league.