 InjuryTommy Tremble: Questionable → Active6 min ago
 InjuryPatrick Queen: Questionable → Active6 min ago
 InjuryDJ Wonnum: Active → Cleared6 min ago
 Pro Football RumorsFormer Broncos LB, ESPN Broadcaster Tom Jackson Passes Away
 Kansas City ChiefsWeek 11 Inactive Players | Cardinals vs. Chiefs
 New Orleans SaintsNew Orleans Saints inactives for Chicago Bears game | 2026 NFL Week 11
 Buffalo BillsBuffalo Bills inactives vs. Dolphins | Week 11
 Tennessee TitansGame Inactives | Week 11 Titans at Cowboys
 Baltimore RavensRookie Running Back Adam Randall Inactive vs. Panthers
 Tampa Bay BuccaneersBucs-Lions Inactives | Baker Mayfield Will Start
 Philadelphia EaglesSteelers vs. Eagles Inactives
 Pro Football RumorsBrandon Aiyuk’s 49ers Tenure Nearing An End? Latest On WR’s Potential Suitors
Week 11 · 2026Colts 3 · 26 Texans
127 plays, one strand. Texans won after 1 lead change; Colts peaked at 61% to win, Texans at 100%. The white spine is the win probability, every rung a snap: up for HOU, down for IND, as long as the yards it gained.
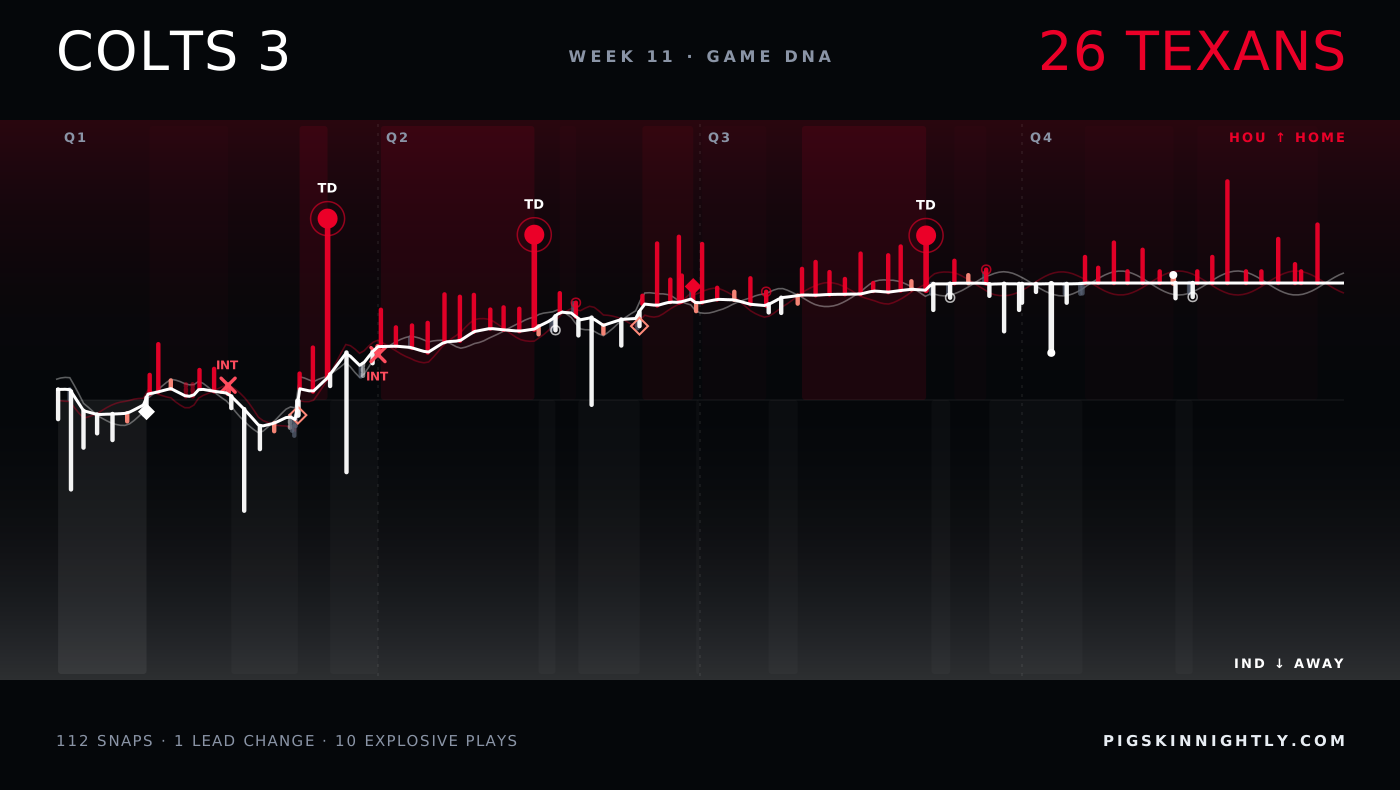
↳Bottom line1 lead change; Colts peaked at 61% to win, Texans at 100%.
?How to read this chart
- Read it left to right:
- kickoff on the left, final whistle on the right.
- The white line
- is the chance that Texans win, play by play. High = HOU in control, low = IND in control, the middle is a coin flip. Each crossing of the middle is a change in who was more likely to win.
- Each little bar is one play:
- up for HOU on offense, down for IND; the longer the bar, the more yards. The key under the picture explains the marks (touchdown, turnover, field goal, punt).
 Texans ↑
 Colts ↓
The strands compared
?How to read this chart
- Each row compares the two teams
- on one stat: IND on the left, HOU on the right. The longer bar is the bigger number.
- Explosive plays
- are long gains (big runs and passes). Peak win prob. is the highest chance to win each team reached at any moment.
Every possession
?How to read this chart
- Each tile is one possession,
- in game order, colored by the team that had the ball.
- Inside:
- the team, how it ended (TD = touchdown, FG = field goal, INT = interception, FUM = fumble, otherwise punt or downs) and the yards gained. Brighter tiles are drives that scored.
The plays that moved it most
↳Bottom lineThe biggest swing: play 1, 2.5 expected points against Texans.
?How to read this chart
- The strip is the game clock;
- each numbered dot is one of the plays below, placed when it happened and colored by the team on offense.
- EP (expected points)
- is how many points the play added to (+) or took away from (−) the offense's expected score. +3.5 EP is worth more than a field goal; big minus numbers are usually turnovers.
- 1Q1 6:59 · HOU · Interception−2.5 EP
7-C.Stroud pass deep right intended for 12-N.Collins INTERCEPTED by 25-A.Haulcy (0-C.Bynum) at IND 25. 25-A.Haulcy to IND 27 for 2 yards (1-
- 2Q1 3:44 · IND · Missed field goal−2.6 EP
3-S.Shrader 56 yard field goal is No Good, Wide Left, Center-46-L.Rhodes, Holder-8-R.Sanchez.
- 3Q1 2:21 · HOU · Touchdown+3.0 EP
57-B.Fisher reported in as eligible. 7-C.Stroud pass deep right to 12-N.Collins for 42 yards, TOUCHDOWN.
- 4Q2 7:43 · HOU · Touchdown+2.7 EP
7-C.Stroud pass deep middle to 14-K.Boutte for 24 yards, TOUCHDOWN.
- 5Q3 10:27 · IND · Sack−2.4 EP
17-D.Jones sacked in End Zone for -7 yards, SAFETY (51-W.Anderson).
- 6Q3 4:28 · HOU · Touchdown+2.3 EP
7-C.Stroud pass short right to 83-M.Klein for 13 yards, TOUCHDOWN. ** Injury Update: IND-34-K.Gushiken has returned to the game.
- 7Q4 13:38 · IND · Completion+2.6 EP
17-D.Jones pass short middle to 6-A.Gould to HOU 43 for 17 yards (2-C.Bullock).
- 8Q4 7:57 · HOU · Run−3.2 EP
57-B.Fisher reported in as eligible. 7-C.Stroud right end to IND 39 for -4 yards (50-B.Boettcher).
The one play that could have changed it
?How to read this chart
- The line is win probability
- over the game (top = home team ahead). The dot marks the one play that could have gone either way; the big % is the losing team's chance right after it.
- Press Flip it
- to see where that chance would have gone if the play had gone the other way. Only that instant is priced: the rest of the game never happened.
3@26Week 11Changes the winnerIf the Colts kicker had made it from 56
Q1 3:44 3-S.Shrader 56 yard field goal is No Good, Wide Left, Center-46-L.Rhodes, Holder-8-R.Sanchez.