 Tampa Bay BuccaneersBucs vs. Lions Game Blog | Week 11 2026
 InjuryJoey Porter Jr.: Active → Cleared4 min ago
 ESPNTravis Kelce passes Rob Gronkowski on TDs by TE list; alone in third all time
 Pro Football RumorsJets May Pursue Vikings HC Kevin O’Connell; Sean McDermott Seen As Likely Hire?
 InjuryAaron Rodgers: Active → Cleared37 min ago
 New York GiantsLive: Highlights & updates from Giants vs. Jaguars
 Denver BroncosStatements from Commissioner Roger Goodell, football world on passing of Ring of Famer Tom Jackson
 Philadelphia EaglesLive Updates: Steelers vs. Eagles
 Pro Football RumorsPats, Cardinals, Ravens Could Pursue Daniel Jones
 ESPNNFL Week 11 arrivals: CeeDee Lamb leads the way ahead of Titans-Cowboys
 InjuryDJ Wonnum: Active → Cleared2 h ago
 InjuryTommy Tremble: Questionable → Active2 h ago
Compare players
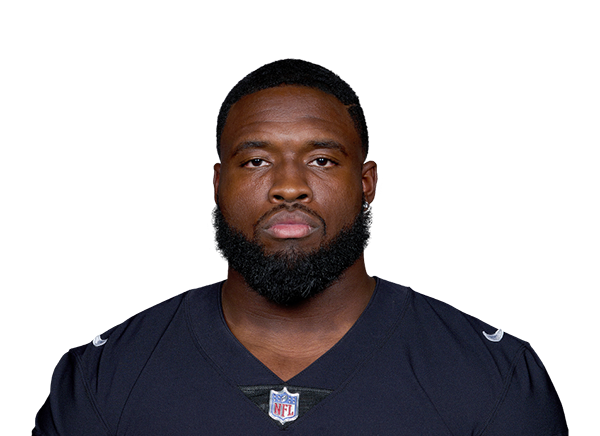 Matthew ButlerDT · MIA
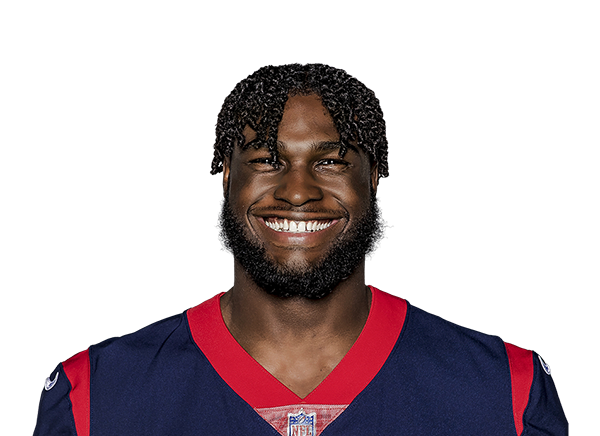 Will Anderson Jr.DE · HOU
 Miami Dolphins
Matthew Butler
Tennessee · 2022 draft, round 5, pick 175
 Houston Texans
Will Anderson Jr.
Alabama · 2023 draft, round 1, pick 3
Not enough numbers in this view to set Butler and Anderson Jr. against each other.
Usage
ButlerAnderson Jr.Percentile chips: vs 189 DL who played half the games, 2026 season
Defense
ButlerAnderson Jr.Percentile chips: vs 179 DL who played half the games, 2026 season
Advanced metrics2 more · tap to open
Usage
Defense
Advanced rows are not part of the “metrics led” count. Pick exactly what you want under “Choose”.
Matchups to start with
top passers · most targetedBox score totals from ESPN (regular season and playoffs; “last 4” is each player's four most recent games with a box score line). EPA, success rate, CPOE, aDOT, target and air-yard share from the nflverse play-by-play over the same games; snap share from nflverse snap counts. EPA per dropback includes sacks and scrambles. Carries are the official ESPN rush attempts; EPA per designed run leaves out quarterback scrambles (they count as dropbacks) and kneel-downs, so for a quarterback the two counts differ. Per opportunity divides counting stats by nflverse dropbacks (passing), ESPN targets (receiving) and ESPN carries (rushing); other counts go per game. Percentiles rank each value among players at the same position with enough volume in the same period (the same groups as the player cards: QBs 12 dropbacks a week, RBs 4.5 carries, wide receivers 2.5 targets, tight ends 2, defenders half the games; fewer than 8 peers, no percentile). The bars compare the players on the page only, not the league.