 ESPNNFL Week 11 arrivals: CeeDee Lamb leads the way ahead of Titans-Cowboys
 InjuryTommy Tremble: Questionable → Active44 min ago
 InjuryTony Adams: Active → Questionable44 min ago
 InjuryDJ Wonnum: Active → Cleared44 min ago
 InjuryYaya Diaby: Questionable → Active44 min ago
 InjuryDerrick Harmon: Active → Cleared44 min ago
 Pro Football RumorsFormer Broncos LB, ESPN Broadcaster Tom Jackson Passes Away
 Kansas City ChiefsWeek 11 Inactive Players | Cardinals vs. Chiefs
 New Orleans SaintsNew Orleans Saints inactives for Chicago Bears game | 2026 NFL Week 11
 Buffalo BillsBuffalo Bills inactives vs. Dolphins | Week 11
 Baltimore RavensRookie Running Back Adam Randall Inactive vs. Panthers
 Philadelphia EaglesSteelers vs. Eagles Inactives
 Pro Football RumorsBrandon Aiyuk’s 49ers Tenure Nearing An End? Latest On WR’s Potential Suitors
Compare players
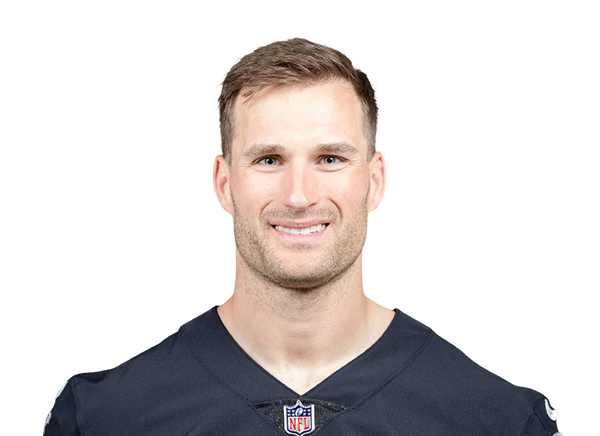 Kirk CousinsQB · MIN
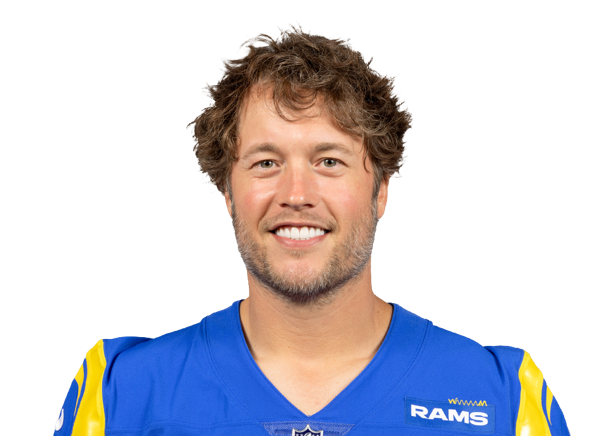 Matthew StaffordQB · LAR
 Minnesota Vikings
Kirk Cousins
Michigan State · 2012 draft, round 4, pick 102
 Los Angeles Rams
Matthew Stafford
Georgia · 2009 draft, round 1, pick 1
Across the 8 shown metrics with numbers for at least two players (2026 season): Cousins leads in 6 and Stafford leads in 2. A count of who is ahead, not a verdict: the metrics overlap and do not weigh the same.
Usage
CousinsStaffordPercentile chips: vs 30 QBs who played half the games, 2026 season
Passing
CousinsStaffordPercentile chips: vs 31 QBs who have 12+ dropbacks a week, 2026 season
Rushing
CousinsStaffordAdvanced metrics14 more · tap to open
Usage
Passing
Rushing
Advanced rows are not part of the “metrics led” count. Pick exactly what you want under “Choose”.
Expected points added across every role (passing, rushing, receiving) in the nflverse play-by-play model, in the period you picked. Lines run the total; a missing bar is a week without plays. The dot marks the best week among the 2 players.
Matchups to start with
top passers · most targetedBox score totals from ESPN (regular season and playoffs; “last 4” is each player's four most recent games with a box score line). EPA, success rate, CPOE, aDOT, target and air-yard share from the nflverse play-by-play over the same games; snap share from nflverse snap counts. EPA per dropback includes sacks and scrambles. Carries are the official ESPN rush attempts; EPA per designed run leaves out quarterback scrambles (they count as dropbacks) and kneel-downs, so for a quarterback the two counts differ. Per opportunity divides counting stats by nflverse dropbacks (passing), ESPN targets (receiving) and ESPN carries (rushing); other counts go per game. Percentiles rank each value among players at the same position with enough volume in the same period (the same groups as the player cards: QBs 12 dropbacks a week, RBs 4.5 carries, wide receivers 2.5 targets, tight ends 2, defenders half the games; fewer than 8 peers, no percentile). The bars compare the players on the page only, not the league.